Improving Zoning Together: Mitigation & Adaptation to Climate Change Outcome

By: Kris Tiongson
January 13, 2026 / Blogs
January 13, 2026 / Blogs
Improving Zoning Together: How do zoning and land use affect climate resilience in Chicago?
Metropolitan Planning Council (MPC) and the Urban Institute are conducting research on how zoning and land use impact Chicago’s neighborhoods and residents from an equity, sustainability, and public health perspective. We are assessing and quantifying the extent to which zoning and changes in zoning have contributed to Chicago’s long-standing inequities across seven priority outcomes: affordable housing, strong business corridors, limited pollution exposure, accessible public transit hubs, productive land use, available groceries and healthcare, and mitigation and adaptation to climate change.
This work on climate change mitigation and adaptation is part of a larger blog series titled ‘Improving Zoning Together‘, which explores our research findings based on each of the research outcomes.
In this blog, we provide a condensed summary of our research into 1) which places and people are most impacted by climate risks, looking at urban heat and flooding, 2) how built environment conditions related to climate impacts differ across Chicago neighborhoods, and 3) how the way land is zoned and used across Chicago neighborhoods is related to climate change impacts.
Which places and people in Chicago are most impacted by climate change impacts?
Despite our abundant freshwater and lower risk of large-scale natural and geologic disasters, Chicago is not immune to the impacts of climate change. Increasingly severe and frequent rainfall has led to increased flooding across the city while rising temperatures heighten urban heat island effect in many neighborhoods. Our research focused on these two climate change impacts.
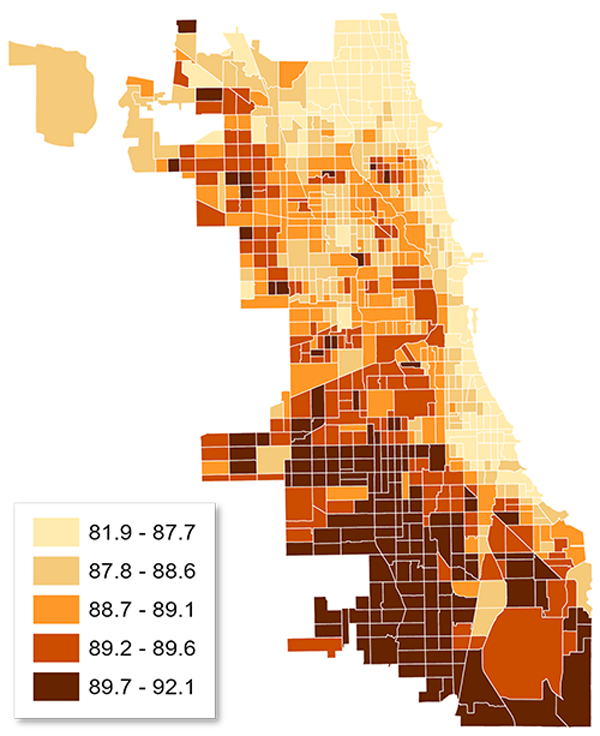
For flooding, we looked at both CMAP’s urban flooding susceptibility index and 311 flooding complaints to the City of Chicago, combining both into a single flood susceptibility index. For heat, we used data from the City of Chicago’s 2023 Heat Watch campaign, focusing on the “heat index,” a measure of felt heat that accounts for both all-day temperature and humidity.
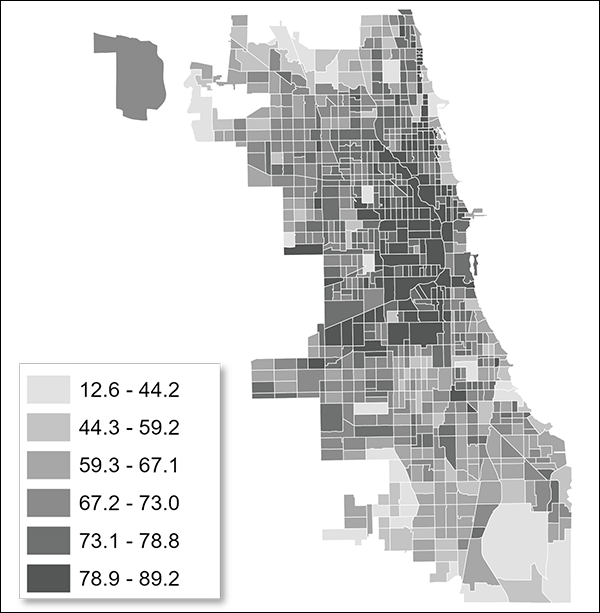
Figure 1 shows the inequitable distribution of urban heat and flooding across the city, separately and then combined. It shows that susceptibility to combined heat and flood impacts is greatest in neighborhoods on the Far South and Southwest sides, as well as pockets of the Northwest side. These include West Lawn, Auburn Gresham, Calumet Heights, Belmont Cragin, and several other neighborhoods with large Black and Latinx populations.
Figure 1
Susceptibility to combined heat and flood impacts is greatest for Far South, Southwest, and Northwest sides
Source: City of Chicago 2023 Cool Chi/Heat Watch, Chicago Metropolitan Agency for Planning (CMAP), City of Chicago data portal
All-day heat index
Flooding index
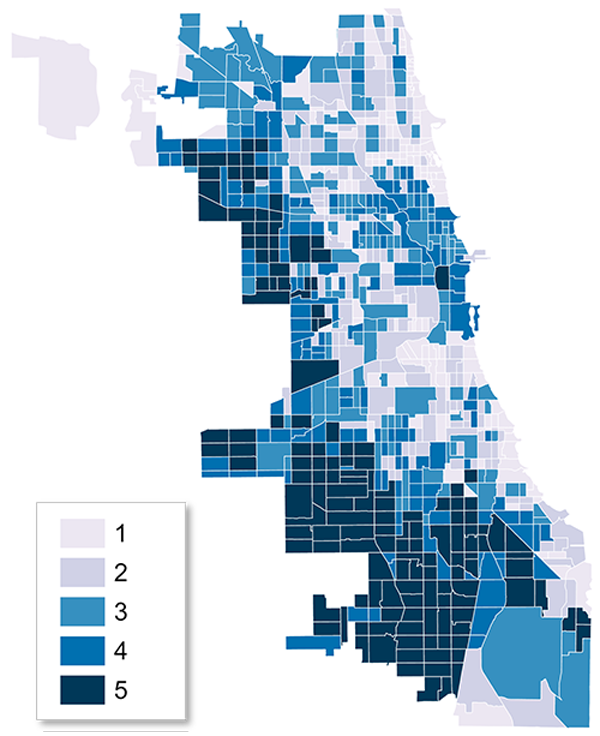
Combined heat and flooding index

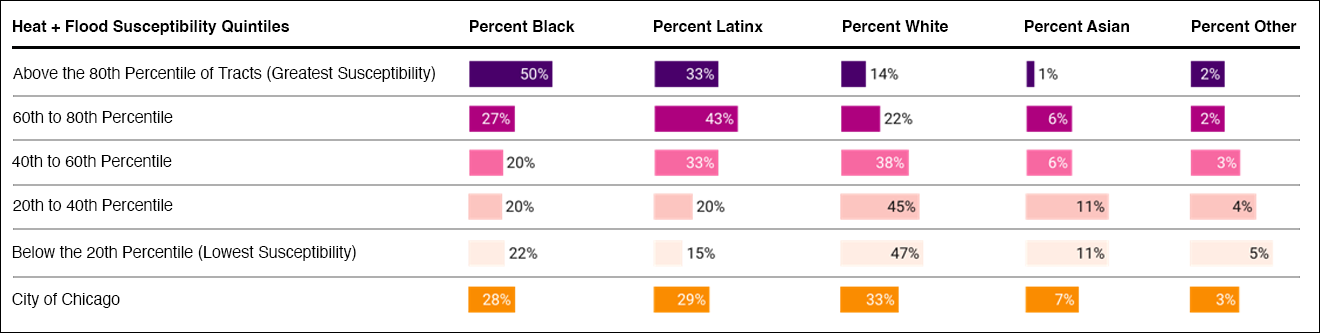
As displayed in Figure 2 below, despite comprising 57% of the city’s total population, Black and Latinx Chicagoans comprise 83% of the population in the top fifth of tracts with the greatest heat and flood susceptibility.
Figure 2
Racial and ethnic composition by combined heat + flood index
Source: Census ACS
It’s worth noting that there are many other factors at play when it comes to how heat and flooding impact people and places. For example, harmful PM2.5 air pollution can combine with heat to intensify health impacts. Meanwhile, some populations—like youth and children, seniors, and those with prior health conditions—are especially vulnerable.
How do built environment conditions related to climate impacts differ across Chicago?
The inequitable distribution of urban heat and flooding is the result of a myriad of factors, many of which cannot be accounted for in our research. However, there are land use factors that can be protective when it comes to climate challenges, such as tree canopy, green stormwater infrastructure (GSI), and energy-efficient buildings. On the flip side, there are land use factors that can worsen susceptibility, such as impervious surfaces, older housing stock, and heavy traffic patterns.
These land use factors are also geographically disparate. For example, Figure 3 shows how tree canopy is sparse downtown and on parts of the Southwest side, which are also where impervious surfaces are highest.
Figure 3
Tree canopy is sparse downtown and on parts of the Southwest side, which are also where impervious surfaces are highest
Source: Chicago Region Trees Initiative (CRTI) 2017, U.S. Geological Survey National Land Cover Database 2023
Percent Tree Canopy Cover (2017)
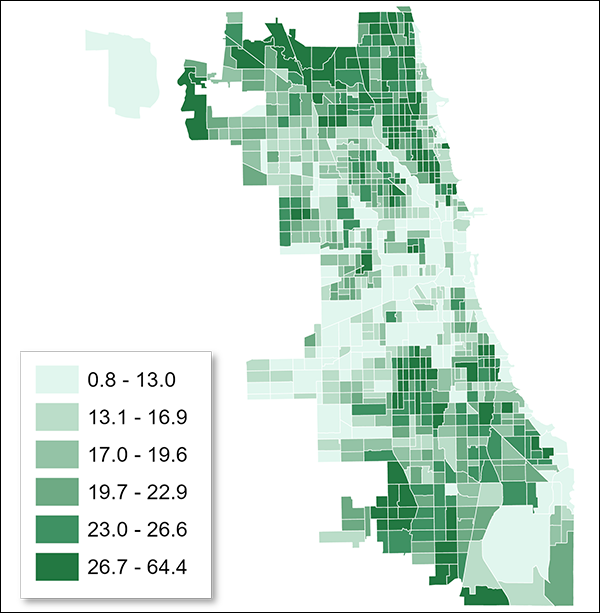
Percent Impervious Surface (2023)
Again, each of these challenges is complex, and there are larger climate patterns and a wide variety of factors that impact the urban heat island effect and flooding events. Evidence of this complexity is that at the citywide level, protective factors such as tree canopy and impervious surfaces are not determinant of heat and flooding susceptibility. The areas with the highest shares of impervious surfaces and the lowest shares of tree canopy coverage do not automatically translate to lower heat and flood susceptibility.
However, our research shows that protective factors can still help at the neighborhood level, at least for heat. We found that tree canopy and open space can have cooling effects on residential neighborhoods, and that parks have a cooling effect that extends beyond their borders. On the flip side, we found that residential areas that lack tree canopy are much more likely to face extreme heat and that manufacturing zoning, industrial corridors, and proximity to heavier right-of-ways such as arterials, highways, and railroads are all associated with greater heat.
How is the way land is zoned and used across Chicago related to climate change impacts?
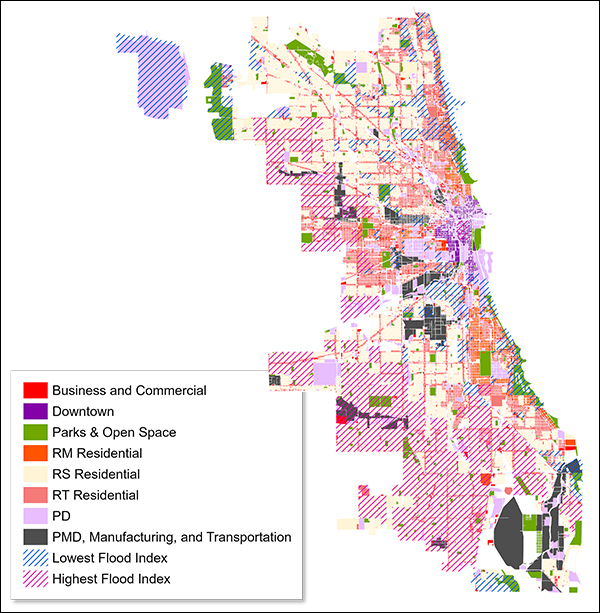
One highlight from our research was that the hottest and most flood-susceptible areas of the city are largely zoned and used as low-density residential land. Figure 4 shows how many of the hottest and most flood-susceptible neighborhoods, particularly on the far South and Southwest sides, are predominately low-density residential areas. Over 60% of land in both the top fifth of tracts with the greatest heat index and the top fifth of tracts with the greatest flood index are zoned RS (Residential Single-Unit), the lowest-density residential zoning district. On the flip side, areas zoned Parks and Open Space, particularly along Lake Michigan, are least susceptible to both urban heat and flooding.
Figure 4
Low-density residential areas are most susceptible, Parks and Open Space areas are least susceptible to both urban heat and flooding
Source: City of Chicago 2023 Cool Chi/Heat Watch, Chicago Metropolitan Agency for Planning (CMAP), City of Chicago data portal
Zoning: Greatest vs. Lowest Heat Index
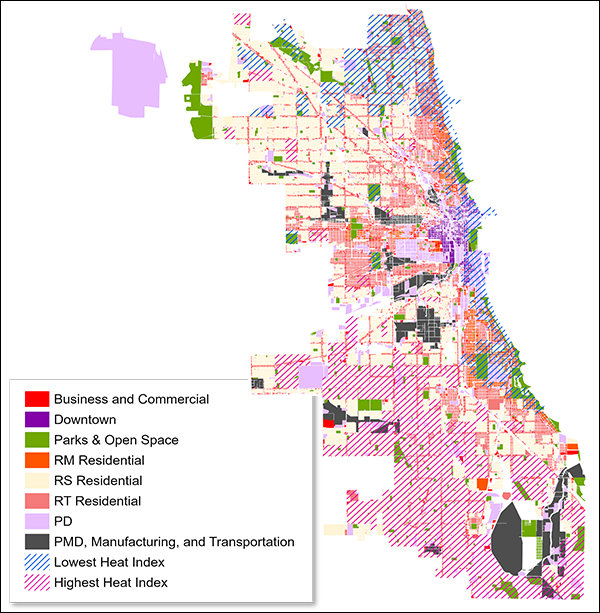
Zoning: Greatest vs. Lowest Flood Index
Looking toward future climate change resilience in Chicago
Our research points to the need for zoning and land use reform to be part of the larger climate action agenda. Chicago’s zoning policies can play a direct role in mitigation and adaptation. Specifically, zoning can directly affect the availability of land for green, permeable spaces through the Parks and Open Space zoning district, setback requirements that require unbuilt space on lots, and the landscape ordinance, a part of the zoning ordinance that impacts planting standards.
It’s also clear that different neighborhoods face different types and levels of climate challenges, requiring different solutions. For instance, some neighborhoods face urban heat challenges, some urban flooding challenges—and some face both, requiring multipronged mitigation and adaptation strategies. Different neighborhoods have different types and availability of land for implementing mitigation and adaptation strategies. This requires a more systematic and citywide effort in drafting neighborhood-level strategies looking at the potential utilities of vacant land, City-owned properties, and land uses with a large amount of pavement like industrial land and heavy arterials.
As MPC and its collaborators continue to assess the many impacts of zoning in Chicago, we are exploring policy recommendations that could proactively realign the zoning code to advance climate change mitigation and adaptation.
Related Reading
Blog Series: Improving Zoning Together
- Improving Zoning Together: Introductory Blog
- Limited Pollution Exposure Outcome (Part 1 of 2)
- Limited Pollution Exposure Outcome (Part 2 of 2)
- Affordable Housing Outcome (Part 1 of 2)
- Affordable Housing Outcome (Part 2 of 2)
- Strong Business Corridors Outcome
- Accessible Public Transit Hubs Outcome
- Available Groceries and Healthcare Outcome
- Mitigation and Adaptation to Climate Change Outcome