Improving Zoning Together: Affordable Housing Outcome (Part 1 of 2)

By: Emma Boczek

By: Rachel Gaunce
April 29, 2025 / Blogs
April 29, 2025 / Blogs
Improving Zoning Together: How do zoning and land use affect housing affordability?
Metropolitan Planning Council (MPC) and the Urban Institute are conducting research on how zoning and land use impact Chicago’s neighborhoods and residents from an equity, sustainability, and public health perspective. We are assessing and quantifying the extent to which zoning and changes in zoning have contributed to Chicago’s long-standing inequities across seven priority outcomes: affordable housing, strong business corridors, limited pollution exposure, accessible public transit hubs, productive land use, available groceries and healthcare, and mitigation and adaptation to climate change.
This is the first of a two-part work on affordable housing. This two-part work is part of a larger blog series titled ‘Improving Zoning Together‘, which explores our research findings based on each of the research outcomes.
In the kick-off blog post to the Improving Zoning Together blog series, MPC shared how we approached the research to explore each of the outcomes that were selected by the project’s Steering Committee 1) Understand the outcome; 2) Understand the zoning; and 3) Understand the relationship.

Using this framing, our partners Yonah Freemark and Lydia Lo at the Urban Institute have conducted an analysis of affordable housing and zoning.
In this blog, we will focus on understanding the outcome: What is the current state of affordable housing in Chicago, and how has it changed over time? In our next blog, we’ll turn to understanding the zoning itself, and the relationship between zoning and affordability, turning to the question: How does zoning shape housing in Chicago, and how does downzoning impact neighborhoods?
Before we go into more detail about the research, the high-level takeaways from Urban’s findings are:
Over the past two decades, housing has become increasingly unaffordable for all Chicagoans, but particularly Black and Latinx Chicagoans. The typical Chicago household cannot afford to buy or rent a home on much of the North and Northwest side. Typical renters in the South and West sides are spending more than 30 percent of their income on rent in their own neighborhoods. Black and Latinx families have seen the greatest declines in housing affordability since 2000.
Affordable housing options are limited and distributed inequitably across Chicago. Some of the most common affordable housing units—federally subsidized units—are concentrated in a few communities on Chicago’s South and West sides and are sparse in the whitest and highest-income areas. Very few of the most affordable housing options like shelters and single room occupancy unit buildings have been built in Chicago since 2006.
What is the current state of affordable housing in Chicago, and how has it changed over time?
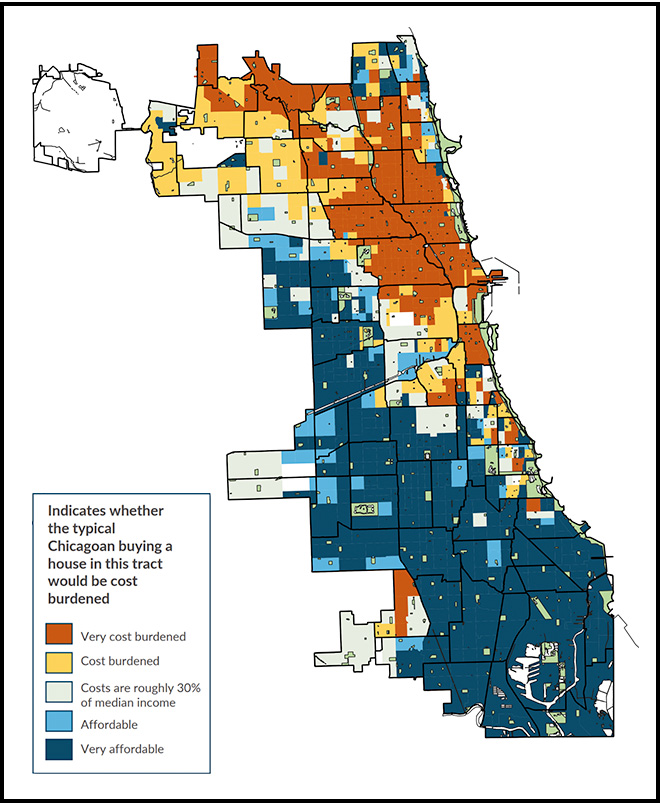
To understand housing affordability in Chicago, Urban used a standard measure for affordability: a household is considered cost-burdened if they are spending more than 30 percent of their income on housing costs. The “typical Chicagoan,” or a household with the median Chicago income, would be cost burdened renting or buying a home on much of the North and Northwest sides of the city (see Figure 1 below).
Figure 1
Created by Urban Institute. Source: Census ACS 2018–2022 via National Equity Atlas.
Median citywide household income in 2022 was $71,673.
Where could the typical Chicagoan afford to rent in 2022?
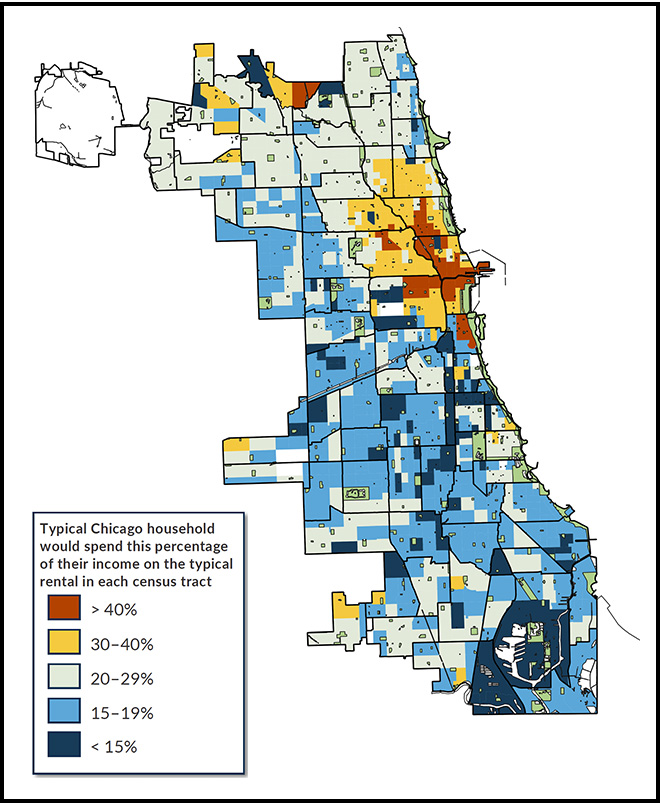
Where could the typical Chicagoan afford to buy in 2022?
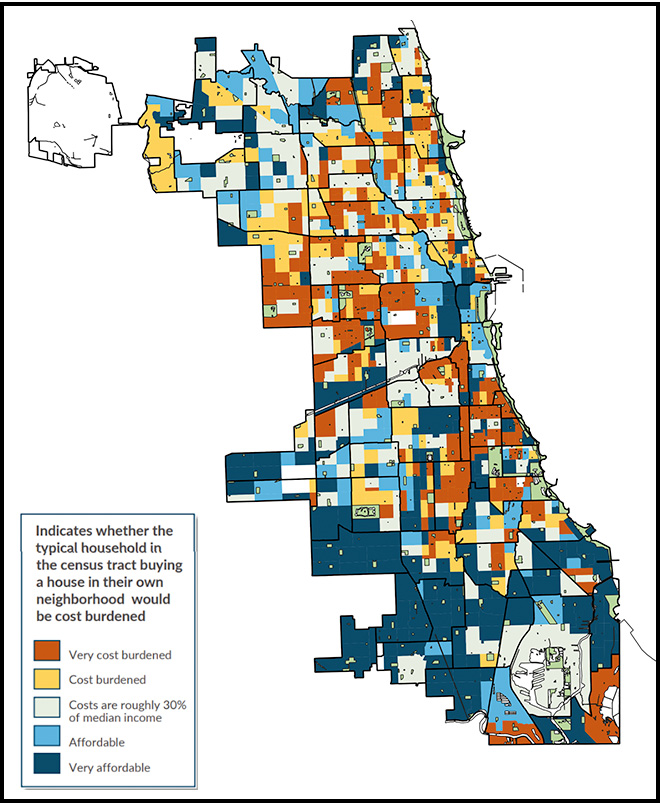
In Figure 2 (below), Urban Institute zoomed into community areas to look at the costs of housing to Chicagoans within their own neighborhoods. They found that renters on much of the South and West sides are cost burdened in their own neighborhoods, and homeownership is unaffordable to residents in their own neighborhoods across the city.
Figure 2
Created by Urban Institute. Source: Census ACS 2018–2022 via National Equity Atlas.
Housing affordability for renters in their own neighborhoods in 2022
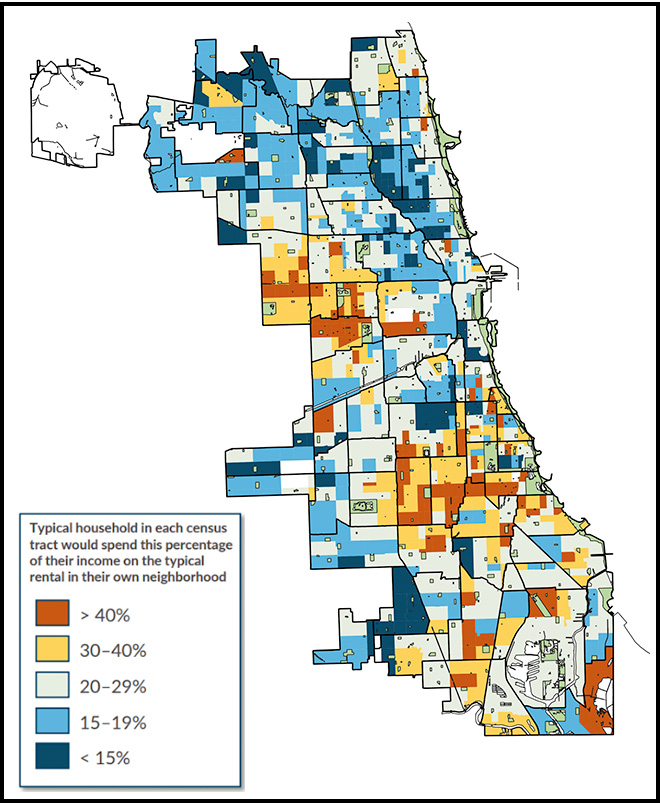
Housing affordability for homeowners in their own neighborhoods in 2022
Between 2000 and 2022, the typical Chicago household’s ability to find housing they could afford has significantly declined. But this decline wasn’t uniform across all racial and ethnic groups (shown in Figure 3 below). The median white household was able to afford rent in any neighborhood in Chicago in both 2000 and 2022—and their ability to buy a home increased in these two decades. In contrast, Black families in Chicago have experienced a dramatic decrease in rental and homeownership affordability. The median Black household was able to afford rent in more than 80 percent of census tracts in the city in 2000, but in 2022, they could only afford to rent in about 60 percent of tracts. Homeownership was affordable in less than 40 percent of Chicago’s census tracts for the median Black family by 2022. Latinx households also saw a significant decline in affordability. Asian households also became less able to afford to rent or buy a home, though the drops were less severe than for Black and Latinx households. This trend underscores growing housing and income inequity in Chicago, where rising costs are outpacing wage growth for many communities, particularly for people of color.
Figure 3

Note: 2000 median incomes: All households: $38,625; White families: $62,680; Hispanic families: $37,166; Black families: $32,776; Asian families: $47,838
2018–2022 median incomes: All households: $71,673; White families: $154,749; Hispanic families: $68,370; Black families: $53,587; Asian families: $89,416
Created by Urban Institute ; Source: Census 1990–2010; Census ACS 2018–2022, both via National Equity Atlas.
As housing costs continue to grow out of reach for many Chicagoans, the need for more affordable and diverse housing options increases. Some of the housing types that can meet the need include federally subsidized housing, single room occupancy (SRO) units, shelters, and senior homes.
However, these affordable housing options are not equitably distributed across the city. As shown in Figure 4, federally subsidized project-based housing units—commonly funded through the Low Income Housing Tax Credit (LIHTC) for affordable housing construction or Section 8 project-based vouchers to subsidize housing costs for residents in designated units—is concentrated in a small share of neighborhoods on the South and West sides. Areas with high white populations and high incomes have very few federally subsidized project-based units. New senior housing has been relatively well distributed across the city since 2006, but there are very few new shelters and SRO units, which are homes where residents typically have a private room but share common spaces such as kitchens and bathrooms (Figure 5).
Urban also examined whether new housing construction creates pressure that pushes out new project-based subsidized units or voucher use, but found no evidence that this “crowding out” occurs; rates of change in project-based units and voucher use were not significantly different in neighborhoods with more housing construction.
Figure 4
Where are subsidized affordable housing units available?

Figure 5
Permits for new housing, by project type, 2006–2024

This research matters because the cost of housing impacts everyone, representing most households’ largest monthly expense. According to the National Low-Income Housing Coalition, there is a need for about 230,000 additional affordable rental homes for very low-income renter households in the Chicago metro area. Our findings confirm that when housing becomes less affordable, the consequences fall on certain communities more than others, primarily Black and Latinx Chicagoans. Making Chicago a welcoming, thriving place to live requires using all the tools we have—zoning included—to ensure that everyone has an affordable place to live.
This blog is part one of two exploring research findings for the affordable housing outcome. Part two focuses on how zoning shapes housing in Chicago, and how downzoning impacts neighborhoods. These blogs are part of the larger “Improving Zoning Together” series which analyzes data on the effects of land use and zoning on the outcomes of limited pollution exposure, affordable housing, and strong business corridors. Overall, the goal of this research is to first inform and then to make changes. If we find that zoning is having an inequitable, unsustainable, unhealthy impact on residents and communities, we can collaboratively advance needed reforms to change this.
For more information about the affordable housing research, reach out to Rachel Gaunce (rgaunce@metroplanning.org) and Emma Boczek (eboczek@metroplanning.org).
Related Reading
Blog Series: Improving Zoning Together
- Improving Zoning Together: Introductory Blog
- Limited Pollution Exposure Outcome (Part 1 of 2)
- Limited Pollution Exposure Outcome (Part 2 of 2)
- Affordable Housing Outcome (Part 1 of 2)
- Affordable Housing Outcome (Part 2 of 2)
- Strong Business Corridors Outcome
- Accessible Public Transit Hubs Outcome
- Available Groceries and Healthcare Outcome
- Mitigation and Adaptation to Climate Change Outcome