Improving Zoning Together: Limited Pollution Exposure Outcome (Part 2 of 2)

By: Kris Tiongson
May 29, 2025 / Blogs
May 29, 2025 / Blogs
Improving Zoning Together: How do zoning and land use affect our exposure to pollution?
Metropolitan Planning Council (MPC) and the Urban Institute are conducting research on how zoning and land use impact Chicago’s neighborhoods and residents from an equity, sustainability, and public health perspective. We are assessing and quantifying the extent to which zoning and changes in zoning have contributed to Chicago’s long-standing inequities across seven priority outcomes: affordable housing, strong business corridors, limited pollution exposure, accessible public transit hubs, productive land use, available groceries and healthcare, and mitigation and adaptation to climate change.
This is the second of a two-part work on pollution exposure. The two-part work is part of a larger blog series titled ‘Improving Zoning Together‘, which explores our research findings based on each of the research outcomes.
In our previous blog, we answered the questions:
- What is the relationship between pollution exposure and zoning,
- How is the way that land is used in neighborhoods related to pollution in Chicago, and
- How does this all affect Chicagoans?
In this blog we turn to changes in manufacturing zoning over time. Specifically, we answer the questions: How has manufacturing zoning changed since 2003, and how does the loss of land zoned for manufacturing relate to neighborhood characteristics and trends?
Before we go into more detail about the research, here are some high-level takeaways:
- Manufacturing zoning continues to decline.
Since 2003, 3% of net city land has been rezoned from manufacturing—an area larger than 74 of the city’s 77 community areas. Some of the areas that have had the most land rezoned from manufacturing include West Loop, areas along the north branch of the Chicago River, and the far south and southeast sides of the city.
- Whiter, high-cost census tracts are more likely to get rezoned to have less manufacturing. Looking at rezonings for the years 2003–2012 and 2012–2023, tracts with decreases in land zoned for manufacturing had higher shares of white population, household incomes, home values, and rents at the beginning of each decade than tracts without decreases.
- Loss of land zoned for manufacturing is associated with some gentrification indicators in some parts of the city, but not all. In central and north side areas like West Loop and the North Branch neighborhoods, loss of manufacturing-zoned land is associated with significantly greater-than-average increases in incomes, home values, and rents. Loss of manufacturing-zoned land in these areas is also associated with increases in white population and decreases in Latinx or Black populations.
How has manufacturing zoning changed since 2003?
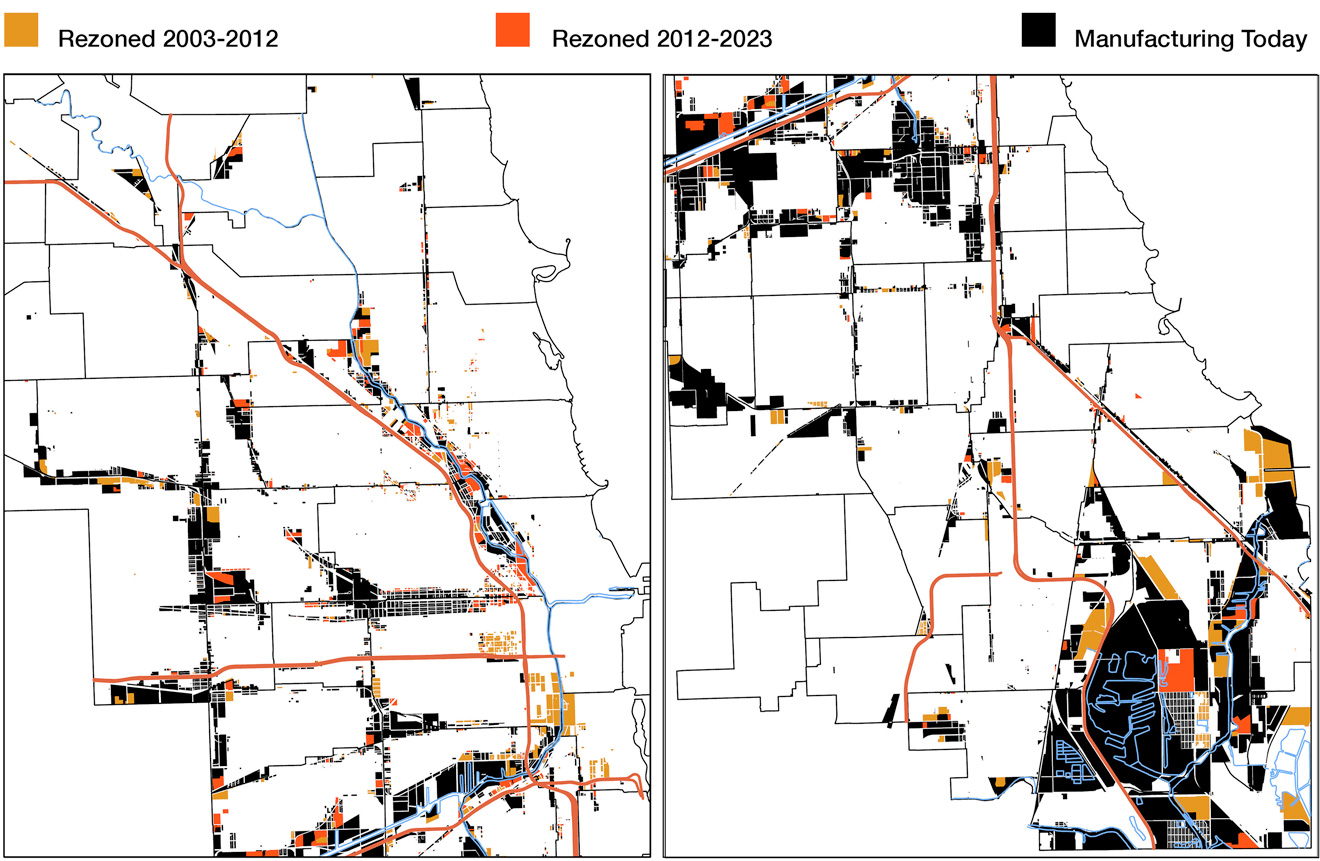
The City of Chicago has rezoned a significant amount of land from manufacturing districts to other districts over time. Since 2003, 3% of net city land has been rezoned from manufacturing. This is an area larger than 74 of the city’s 77 community areas. As Figure 1 shows, the extent to which different areas of the city had land rezoned from manufacturing—and when these rezonings occurred—varies. For example, there was twice as much rezoning between 2003 and 2012 than in the decade after, and rezonings were much more concentrated in a few parts of the city. Specifically, rezonings in the earlier decade were concentrated around Lake Calumet in the Pullman, South Deering, and South Chicago neighborhoods in the southeast side. Large swaths of West Loop and Near South Side were also rezoned from manufacturing, although, some of these were merely manufacturing districts being reclassified as downtown service districts, introduced as part of the 2004 zoning ordinance update. Although at a much smaller scale, rezonings of manufacturing land between 2012 and 2023 spread out more across the city, particularly in the neighborhoods along the north branch of the Chicago River.
Figure 1
As manufacturing gets rezoned, what does it become? We found that manufacturing land most often gets rezoned as part of Planned Developments (PDs). As Figure 2 shows, 47% of manufacturing rezoned from 2003 to 2012 became PDs. Between 2012 to 2023, this percentage rose to 62% of total rezoned manufacturing. The types of rezonings also vary widely across the city. For example, while 20% of manufacturing was rezoned to parks and open space in each of the last two decades, these almost entirely occurred in the southeast side of the city around Lake Calumet. Changes in manufacturing zoning do not automatically equate to changes in actual land uses—meaning what’s happening on the ground. For instance, formerly manufacturing-zoned land that are now PDs may look very different in South Chicago and Pullman, compared to West Loop and along the north branch.
Figure 2

How does loss of land zoned for manufacturing relate to neighborhood characteristics and trends?
MPC also wanted to better understand which areas and neighborhoods were more likely to have land rezoned from manufacturing and what happens in neighborhoods as this loss occurs. This analysis looks at demographic and economic indicators including race and ethnicity, median household income, median home values, and median gross rents across census tracts and then compared tracts that lost manufacturing zoning against tracts that did not. First, we looked at the data at baseline and conducted t-tests, which tests for statistically significant differences between the means (average values) of two groups. As Figure 3 shows, analysis indicates that for each decade of rezoning, tracts that lost manufacturing zoning had higher shares of white population, higher median household incomes, home values, and gross rents at the beginning of each decade than tracts that did not lose manufacturing zoning. In other words, whiter, high-cost tracts are more likely to have land rezoned from manufacturing.
Figure 3

Second, to understand what happens in neighborhoods as they lose land zoned for manufacturing, we compared the concurrent demographic and economic changes between the two groups of tracts to answer the question—how do the demographic and economic characteristics of areas shift as they lose manufacturing zoning? Could the loss of manufacturing zoning, for instance, be linked to certain gentrification indicators? This time around, we had mixed results. As Figure 4 shows, loss of land zoned for manufacturing is associated with significantly greater increases in household incomes and either slower Latinx population growth or downright Latinx population loss. However, differences were either insignificant or partially significant for the other changes.
Figure 4

These citywide t-tests have limitations, so we conducted some additional GIS mapping. What we found was that neighborhood-level dynamics simply vary widely across the city. For instance, Figures 5 and 6 show a comparison of some of the demographic and economic changes in neighborhoods along the north branch of the Chicago River compared to neighborhoods around Lake Calumet on the southeast side. We found that since 2003, as substantial amounts of land in neighborhoods along the north branch were rezoned from manufacturing, household incomes, home values, and rents increased substantially more than the citywide average. For example, household incomes increased 3.4x greater than the city average in the earlier decade and 1.7x greater than the city average in the subsequent decade. Home values increased 3.7x greater than the city average in the earlier decade and 1.4x greater in the subsequent decade. (See Figure 5). This area also saw substantial increases in white population and decreases in Latinx population. On the other hand, Figure 6 shows that since 2003, as substantial amounts of land in neighborhoods around Lake Calumet in the southeast side were rezoned from manufacturing, demographic and economic changes were outpaced by the citywide changes.
In summary, we can say that there appears to be some association between loss of land zoned for manufacturing and certain gentrification indicators in some parts of the city like along the north branch. Some other parts of the city that have seen similar dynamics include West Loop. In West Loop, rezoning of manufacturing land was also associated with greater-than-average increases in household incomes, home values, and rents, as well as increases in white population and decreases in Black population. These dynamics do not appear to be the same in many other parts of the city like the southeast side. These analyses do not suggest that rezoning of manufacturing districts causes gentrification, or vice versa. That is a much harder question to answer. However, these findings suggest that it is important to account for a change in zoning designation from manufacturing may result in other neighborhood changes, like the potential displacement of residents.
Figure 5
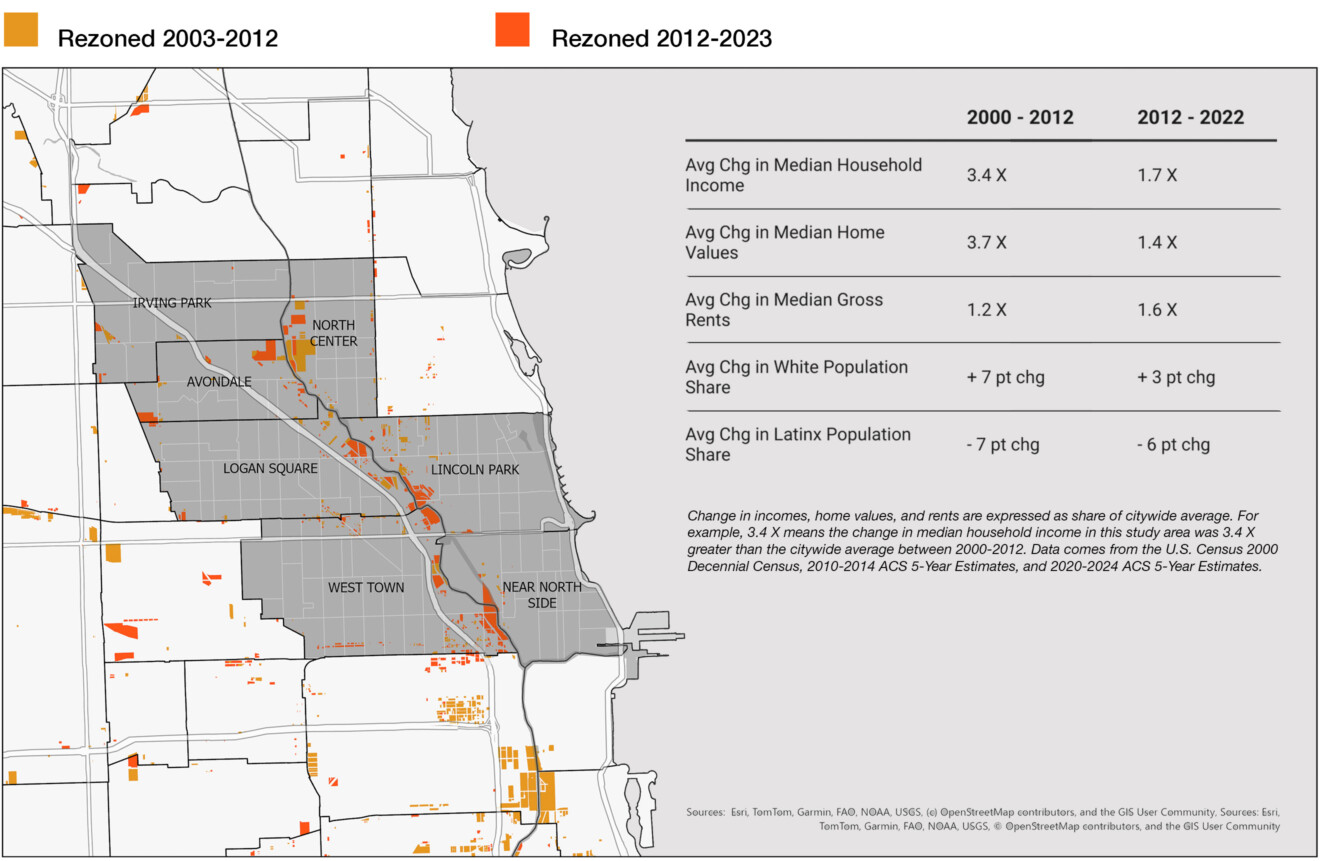
Figure 6

Why does this research matter?
Our findings show the nuances around changes in manufacturing zoning districts over time and the difficulties in classifying different manufacturing districts by their actual uses and externalities. Ultimately, as we begin to discuss specific policy recommendations for limiting pollution exposure, it is important to account for what manufacturing zoning and uses mean for different neighborhoods and what policies are needed to ensure that any resulting policy changes do not lead to inequitable outcomes, such as displacement.
This blog is part two of two exploring research findings for the pollution exposure outcome. This two-part work makes up one section of the series Improving Zoning Together, which analyzes data on the effects of land use and zoning on the outcomes of pollution exposure, affordable housing, and business corridors. Overall, the goal of this research is to first inform and then to make changes. If we find that zoning is having an inequitable, unsustainable, unhealthy impact on residents and communities, we can collaboratively advance needed reforms to change this. For more information about the pollution exposure research, reach out to Kris Tiongson (ktiongson@metroplanning.org).
Related Reading
Blog Series: Improving Zoning Together
- Improving Zoning Together: Introductory Blog
- Limited Pollution Exposure Outcome (Part 1 of 2)
- Limited Pollution Exposure Outcome (Part 2 of 2)
- Affordable Housing Outcome (Part 1 of 2)
- Affordable Housing Outcome (Part 2 of 2)
- Strong Business Corridors Outcome
- Accessible Public Transit Hubs Outcome
- Available Groceries and Healthcare Outcome
- Mitigation and Adaptation to Climate Change Outcome