
Understanding Our Citywide River System
About the Project
The Chicago River System has evolved since the launch of the Our Great Rivers initiative. To determine if Chicago is reducing barriers to the good life and fostering shared prosperity for its residents and business all along the river system, this evaluation notes how the system and its surrounding communities have changed over time. Consistent with the project structure, the findings are organized into the themes of inviting, productive, and living.
About the Approach
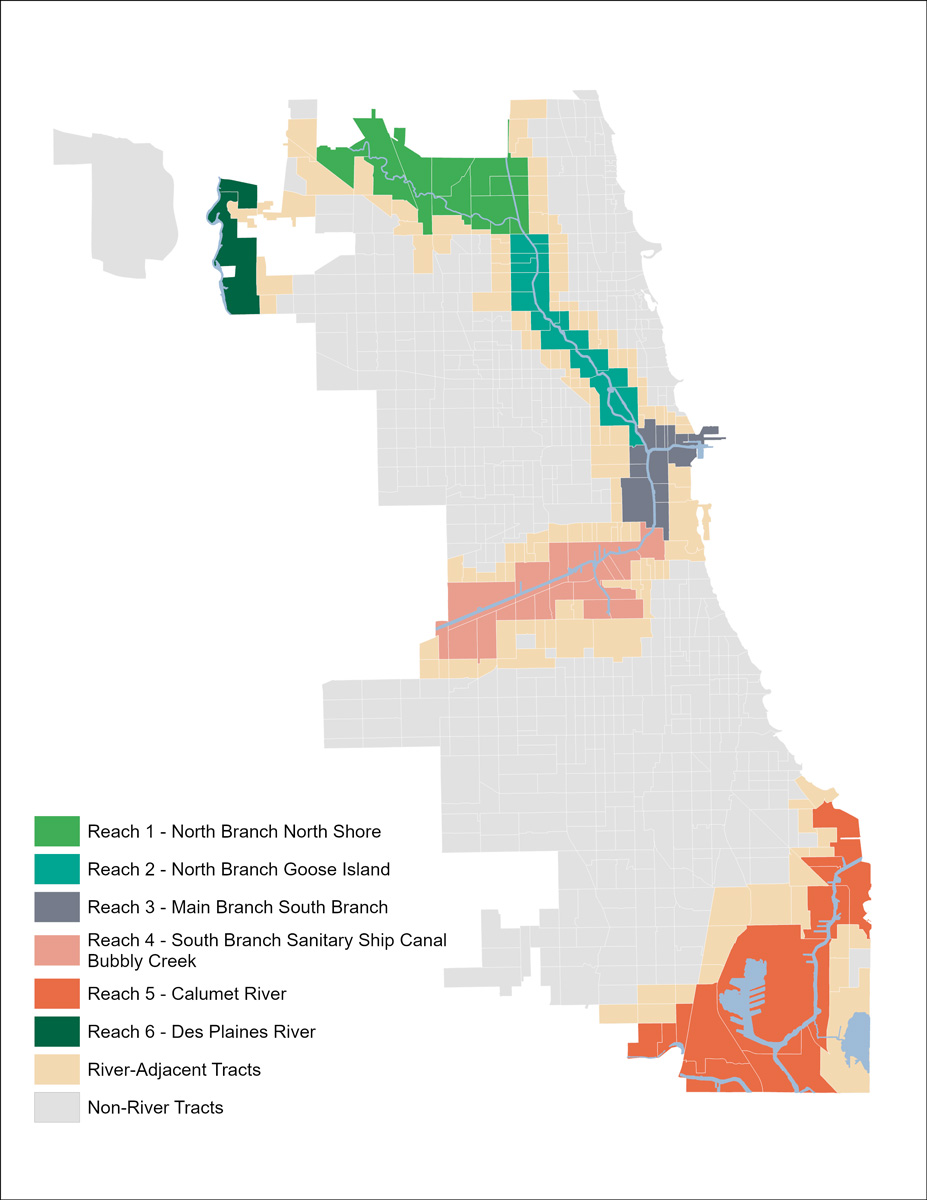
The Our Great Rivers project considers the Chicago River System as six distinct areas, or ‘reaches.’ The following analysis shares demographic, socioeconomic, community development, and ecological data and trends between approximately 2015 and 2025 to detail transformations along or near the river system.
In the Current
Want to get to know the catalytic projects and leaders bringing the vision of Our Great Rivers to life? To learn more about the initiatives and people creating lasting benefits for communities and the river ecosystem, explore some stories of transformation:
A Glimpse Into the Chicago River System
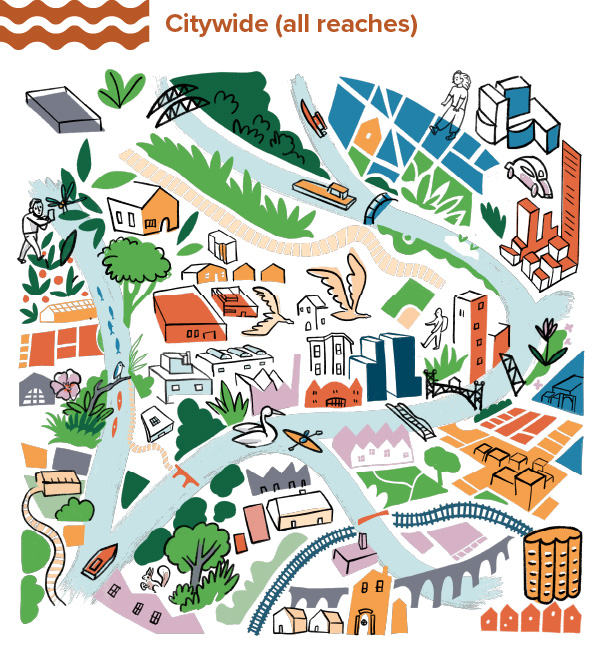
The Chicago River system is comprised of the North Branch, Main Branch, South Branch of the Chicago River, the Calumet River, and the Des Plaines River. Together, these waterways total more than 150 miles, making the rivers a defining feature of the city’s landscape and an incredibly powerful asset for Chicago and its communities. As a vital economic engine, destination for recreation, and habitat for fish, birds, and other wildlife, the Chicago River System has the potential to support thriving neighborhoods, connect communities, and ensure environmental and economic well-being for the entire region.
MPC developed data points to characterize changes along Chicago’s River System between approximately 2015-2025. This page gives a general overview of the ways the area surrounding this reach has, or has not, transformed. For more in-depth data, further analysis, and the sources used for this research, view the complete data sets at the link below.
 Increasing
 Decreasing
 Same or similar
 Good
 Fair
 Poor
How has the area changed over time?
2014-2022
Demographics
Chicago’s population was stable between 2014 and 2022. While tracts far from the river lost population, the population near the river grew—in fact, the population in tracts closest to the river grew by 8%, mostly driven by population growth in the Main Stem downtown.
The growth looked different by racial group. The population of white and Asian residents near the river increased (7% and 38%, respectively), while the population of Black residents remained stable, and the population of Latinx residents decreased (0.4% and 6%, respectively). Chicago lost a greater percent of Black residents overall (10%), whereas the Latinx population remained stable citywide even as fewer Latinx residents lived near the river.
Socioeconomics
Since 2014, the median household income in Chicago increased at a slightly higher rate of 53% near the river, compared to the citywide rate of 49%. Owners of tracts adjacent to, but not directly along, the river saw an even higher income increase of 59%. Rental costs increased slightly more in river tracts (39%) and river adjacent tracts (40%) than they did citywide tracts (33%). Home values increased along the river (38%) at a similar rate as the city (37%). Home values increased slightly more in river adjacent tracts (42%).
Inviting Rivers Data
How has the area become more, or less, inviting?
General Findings
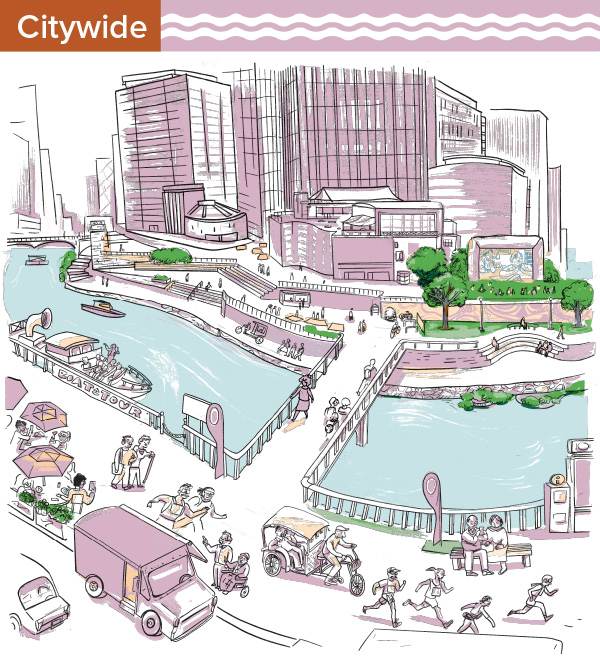
Land use data provides a picture of Chicago riverfronts and the number of inviting opportunities, such as riverside access for pedestrians, retail opportunities, and recreation. This data reveals that Chicago’s riverfronts are inviting in places, but that most such opportunities are on the North Side, revealing there is much work to be done to make Chicago’s rivers inviting systemwide.
Overall, areas near the river have more industrial land uses, utility, and waste—remnants of days when waterways were predominantly used for industry, particularly in industrial corridors along the South Branch of the Chicago River and the Calumet River, which have significantly more such land uses than the other river reaches.
There is also far less single-family housing near those rivers than in the city overall. Single family homes predominate on the north side, near the North Branch/North Shore and North Branch/Goose Island river areas. Significantly more multi-family homes than the city average are located in the Main Branch/South Branch area. Commercial uses are almost exclusively located in this area, as well.
There are large amounts of open space alongside the Des Plaines River, representing 77% of the land use. This space consists primarily of Forest Preserve District of Cook County land and the North Branch/North Shore reach, which has significant amounts of Park District land. Open space is a much smaller proportion of the land uses across other reaches.
Connectivity and riverfront access vary across the city. There is greater trail coverage in less industrialized reaches of the Chicago River like the downtown (where 60% of the river edge has a trail) and the North Branch/North shore (where 98% of the river edge has a trail). The Calumet has the least trail coverage (6%).
Since 2010, the amount of open space near the river has increased, while the city overall has seen a very slight decrease in open space. River areas have experienced a slight decrease in commercial uses, while commercial uses grew citywide. Otherwise, most land use in river areas has remained relatively stable and consistent with citywide land use trends.
Productive Rivers Data
How has the area become more, or less, productive?
General Findings
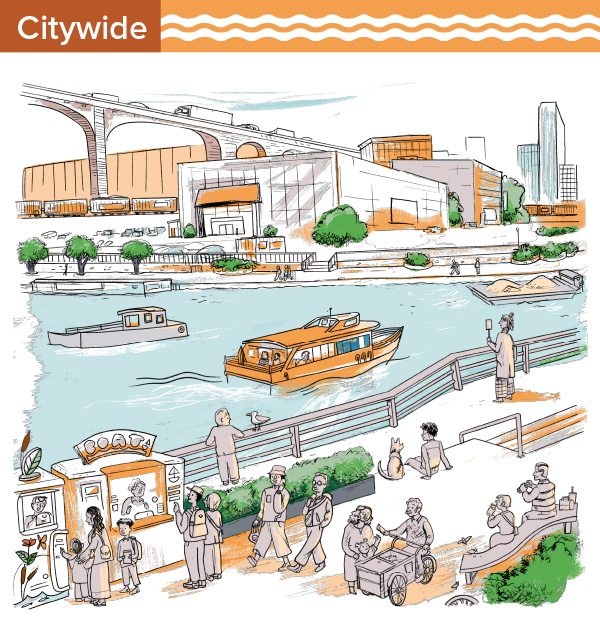
Our riverfronts are productive areas, typified by increasing jobs and decreasing vacancies. Specific economic indicators provide a picture of how the Chicago region depends on its rivers as business generators and employment hubs that grow jobs and strengthen the economy.
The river—which runs through downtown and includes many industrial corridors—is a significant job provider. The City of Chicago had 1,320,135 jobs in 2021, and more than half (712,116) were located in river tracts. The majority of jobs (578,035) were located in the downtown river reach, Main Branch/South Branch.
Outside of the downtown, many of these jobs are also located along the South Branch reach, as well as the North Branch/Goose Island reach. A smaller amount are found in the other three reaches.
Since 2012, jobs in river tracts increased more than jobs citywide, indicating that employment is growing in businesses and industries located along the river. Most of this growth was centered in the downtown reach, and somewhat in the North Branch/Goose Island Reach, and the Calumet River.
Although Chicago jobs grew, from 2013 to 2023, the overall number of businesses decreased by almost 25% citywide and 31% in river areas. This decrease was relatively consistent across all river reaches. By 2023, there were 42,171 businesses in Chicago, and approximately a quarter (10,106) were in river tracts.
In 2022, the city had 33,712 vacant parcels (meaning land with no development), with a vacancy rate of 6%—an increase of 5% from 2014. River areas, which have the same vacancy rate overall of 6%, saw a 4% decrease in vacant parcels during this time period, indicating that river areas were experiencing more turnover than across the city generally.
Much of this decrease was driven by the South Branch Reach and, to a lesser extent, the Calumet Reach. The North Branch/Goose Island river area saw a 13% increase in vacancy.
Living Rivers Data
How has the area become more, or less, living?
General Findings
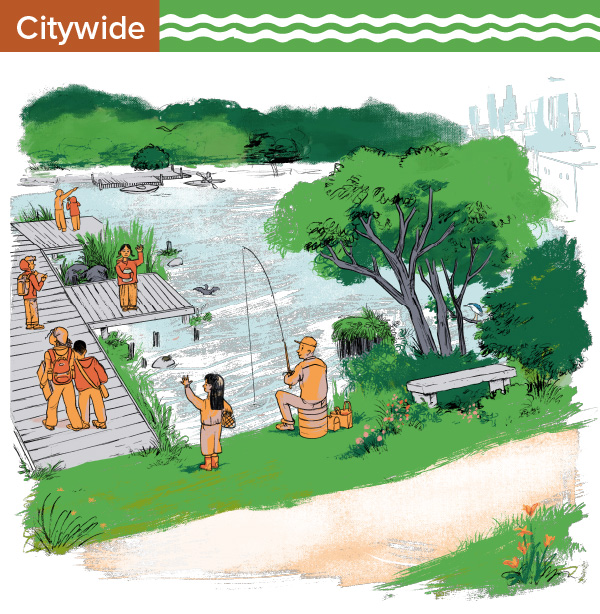
Our riverfronts are living, but there’s still much to be done to improve the health of the rivers.
By analyzing data, such as fish diversity, open space, and combined sewer overflows (CSOs), we can better understand Chicago’s rivers and how they can serve as supportive places for human and ecological health.
The river system has historically been used for industry in Chicago, a legacy that continues to this day. Some river areas have experienced significant improvements in water quality, while others are still struggling. The Metropolitan Water Reclamation District of Cook County (MWRD) maintains a monitoring station in each reach area of the river system. We used this monitoring station data to evaluate fish species diversity and CSO events over time.
The biodiversity of the Chicago river system’s fish population has come a long way. In the 1970s, there were fewer than 10 species of fish in our river system. Today, thanks to decades of habitat restoration and advocacy from organizations highlighted throughout this website and beyond, there are more than 80 recorded species. Fish move throughout the river system, and the number of recorded species in a given reach provide only a snapshot in time based on when the data was collected. Though there are these limitations to collecting fish species counts, MWRD monitoring station data averages over time show that fish diversity was lower in the North Branch/North Shore and higher in the other reaches. There was no fish diversity data for the Des Plaines reach of the Main Branch/Downtown reach.
Chicago has a combined sewer system, meaning that sewage and stormwater from rainfall and melting snow enters the same pipe system. When this system is overwhelmed, the combined sewage and stormwater is emptied directly into our river system, polluting the river and increasing the risk of flooding. This emptying of sewage and stormwater into the river system is called a combined sewer overflow (CSO). Across almost all reaches, the number of CSO events was significantly higher in 2016 than in 2021. In particular, CSO events in the North Branch/Goose Island reach decreased from triple digits to single digits, while events in the South Branch decreased from triple to low double digits. CSO events are complex: the severity of each event depends on the location, amount of impervious surfaces that exacerbate runoff, weather conditions, and other factors. MWRD’s Tunnel and Reservoir Plan, also known as the Deep Tunnel, has played a major role in the reduction of CSOs in the Chicago river system. MWRD has been building a system of tunnels and reservoirs designed to hold water during major storm events and prevent CSO’s in Chicago’s rivers since 1975. The project is still in process, with an additional stage of one of the largest reservoirs planned to be operational by 2032. Despite this progress, our region has not seen a complete elimination of CSO events, and some years continue to see more severe CSOs than others. It is important to continue to make ongoing efforts to reduce stormwater runoff and mitigate CSO events, as the effects of climate change, such as the heavy rainfall events we saw in the summer of 2026, continue to pose pollution and flooding challenges to the Chicago region.
Most of the reaches are surrounded by land uses that are relatively low in open space, with the exception of the North Branch/North Shore, which has a moderate amount of open space, and the Des Plaines River, which has a very high amount of open space.
Explore the research on other reaches in the Chicago River System below.
Visit river reach pages:
View the complete data sets for each of the river reaches:

Learn more about Our Great Rivers and this Understanding Our Rivers evaluation project.
Methodology
Research Approach
This project examined how areas (census tracts) along the river changed over time, from approximately 2015 to 2025. Data related to demographic, socioeconomic, development, and ecological changes, were compiled to understand how areas along the river transformed over the decade. Trends/variables included:
- Population changes by racial and ethnic group
- Rent and home value changes
- Job, business, and vacancy rate changes
- Land uses
- Trails and access points
- Community projects and activations
- Fish diversity
In addition to breaking down the river geography at the citywide and “reach”-level scale, we examined data by census tracts based on their proximity to the river:
- River tracts: Census tracts that touch a river in the city of Chicago
- River adjacent tracts: Tracts that touch the “river tracts.” Data in these tracts act as a proxy to the nearby neighborhood in order to differentiate general neighborhood trends from findings that are unique to tracts that directly abut the river.
Research Questions
For each data area, we asked the following questions, which allow for a nuanced look at how river areas have developed, when compared to other parts of the city:
- How do trends/changes compare across specific river areas (aka “reaches”)?
- How do trends/changes along the river (aka “river tracts”) compare to changes in areas immediately adjacent to river census tracts (aka “river adjacent tracts”, which are the comparison groups)?
- How do trends/changes along the river compare to changes across the city as a whole (all city census tracts)?
Sources
All sources for this research are listed on the Data Set Factsheets available on each reach page.
Authors
This evaluation project was produced by the MPC staff listed below. It was also developed and supported by Christina Harris, Alec Singer, and Kate Mackie.


