The Cost of Segregation
Billions in lost wages. Thousands of young people without the education they need to fulfill their potential. Hundreds of lives cut short by violence. These are among the steep costs all of us in the Chicago region pay by living so separately from each other.


Everyone deserves an opportunity to earn a living—and the economy is better off when everyone participates in it. Yet, not everyone in the Chicago region has the same pathway to economic success.
Over generations, policies and practices have set up barricades in and around Chicago, ultimately leading to a region where people of different races and incomes live separately from one another. Some of these boundaries can be seen on a map. Others are invisible yet powerful barriers that affect local public school performance, business investment, workers’ preparation for today’s jobs and what kinds of employment—if any—are available within a reasonable commute of where a person can afford to live.
Like bricks of a wall, these decisions have stacked up over decades, and individuals, communities and our entire region are living with the consequences.
Economic and racial segregation has strangled opportunities for millions of people. Disinvestment has devastated entire city neighborhoods and suburban villages, towns and cities. Lack of diversity also hurts affluent communities, where limited housing options often mean that young people cannot afford to return when starting their own families, retirees cannot afford to stay and valued employees are priced out.
Add it up, and it’s clear that segregation holds back the entire region’s economy and potential—and whether we realize it or not, it’s costing all of us. Our social fabric and our economy will be stronger if we all have more opportunities to live, work and go to school with one another.
The Metropolitan Planning Council, together with Urban Institute and a team of regional policy advisors, analyzed segregation patterns in the 100 largest metropolitan areas in the country. We examined three types of segregation: economic segregation, African American-white segregation and Latino-white segregation. We then examined what impacts we would see if the Chicago region reduced its levels of segregation to the median levels of segregation of the nation’s 100 biggest metros.
The core of this report is a summary of our findings. The findings for African American-white segregation were the most pronounced in our study, yet they are not the only indicator of how segregation is experienced by race in this region. We share additional data about the impact of segregation on Latinos at other points in this report.
We embarked on this study with two driving questions in mind:
What does it cost all of us in metropolitan Chicago to live so separately from each other by race and income?
What can we do to change these patterns of segregation, so that everyone living in our region can participate in and create a stronger future?
The answer is that segregation is not only an issue in low-income communities or communities of color. Everyone pays a price, measured in lost income, lives and education.
The Chicago region’s gross domestic product, a leading measure of economic performance, would also rise by approximately $8 billion.[1] That’s an increase two-and-a-half times greater than the Chicago region’s average annual growth of the gross domestic product. This is a boost sure to create significant positive ripple effects for our region and its tax base.
The link between segregation, job access and income
Source: Graph by MPC, based on analysis of 1990 and 2000 Censuses and 2008–2012 five-year American Community Survey.
Research shows that economic segregation and income inequality compound and exacerbate each other’s effects.[2] With income and wealth inequality on the rise nationally since 1980, household resources available to spend on housing vary by community. The housing market reacts to this inequality in ways that worsen segregation: Affluent households are more able to comfortably afford high-cost options in certain communities, while lower-income households spend higher shares of their income for lower-cost options in different communities.
The result is a self‐reinforcing cycle, in which income inequality creates segregation and segregation furthers income inequality.[3] These lowered incomes have a cost: research has shown that if the average incomes of people of color were raised even beyond the national median, up to the average incomes of whites, our gross national product would increase by $1.9 trillion.[4]
How do we reduce income segregation and racial earning and wealth gaps? It’s not simple, and the answers may range broadly, from creating a local Earned Income Tax Credit to housing policies that avoid concentrating where the wealthy and the poor live, to more transit options to connect workers to jobs. MPC will be exploring these policies and many others as we seek a path forward for accelerating our desegregation.
There is no way to fully account for a lost human life. However, it is possible to tally a number of relevant direct and indirect costs. Using the region’s 2010 homicide rate—the most recent figures available at the regional level—our study found that the Chicago area could have boosted its economy simply by being a safer place to live.
If the regional homicide rate had been 30 percent lower in 2010…


The link between homicides, segregation and strong communities
Source: Graph by MPC, based on data from the Chicago Police Department, Research and Development Division, 2011 Chicago Murder Analysis
Chicago’s rising homicide rate since 2010 is an urgent concern for the region because any untimely loss of life is a tragedy. For too long, though, too many have had the misperception that Chicago’s violence did not impact them. In fact, violence has a ripple effect: it removes residents from communities by death and incarceration, unravels families and traumatizes survivors. Each of these factors saps the capacity of students and workers and makes the city and region a less appealing place to live and work. Of the 10 U.S. cities with highest murder rates, Chicago ranks eighth. Most of these cities have high levels of economic and racial segregation as well.
Chicago is a microcosm of both trends: In 2016, more than half of the city’s homicides occurred in 11 communities that were predominantly people of color and home to some of the city’s highest rates of poverty. Chicago ranked last in population growth in 2015 among the nation’s 10 largest cities. One study firmly links homicides to population loss for cities, positing that every additional homicide over the previous year results in the loss of 70 residents.[8]
So what drives Chicago’s relationship between segregation and homicides? How can we improve public safety in our communities to save lives, as well as maintain a thriving economy, stable property values and a growing population? These are among the questions MPC is asking as we seek solutions to Chicago’s violence and its segregation. In our next phase of work, we are focusing on four areas: police reform, the geographic concentration of crime and violence, criminal justice policy, and how place impacts the re-entry and recidivism of people with criminal records. Learn more »
The lifetime earnings gap between a person with a high school diploma and a person with a four-year college degree is $1,078,446[9] Our research found a correlation between lower levels of segregation and a higher percentage of the population holding a bachelor’s degree, for both African Americans and for whites.
This means the Chicago region is losing out on some $90 billion in total lifetime earnings as a result of our education gap.
Source: Graph by MPC, based on analysis of 1990 and 2000 Censuses and 2008–2012 five-year American Community Survey.
The link between segregation, school quality and college preparedness
Education is the backbone of a prepared workforce. And the more educated a region’s workforce, the more attractive that region is to employers. Yet the U.S. President’s Council on Jobs and Economic Competitiveness found that by 2020 there will be 1.5 million too few college graduates nationwide to meet employers’ demand.
The Chicago region is already losing ground. Just 12 percent of the region’s Latinos over the age of 25 held bachelor’s degrees in 2010, compared to 20 percent for African Americans and 44 percent for whites. The region ranked ninth among the nation’s 10 largest metro areas in the rate of new job growth from December 2015 to December 2016, according to the latest report from the Bureau of Labor Statistics.[10] If Chicago is to unlock its competitive advantages and prepare the next generation of educated workers, deliberate desegregation must be emphasized.
Education must play a major role in the region’s long-term growth. We are exploring strategies to provide diverse educational settings and ways to replicate sound policies that are working in public schools—these types of policies will be key to prepare the Chicago region for tomorrow’s job market.
How Chicago compares
In 2010, the Chicago region had the…
- 5th highest combined racial and economic segregation
- 9th highest Latino-white segregation
- 10th highest African American-white segregation
- 20th highest economic segregation
The Chicago region is not alone when it comes to being racially and economically segregated—metropolitan regions around the country remain starkly segregated. Yet two-thirds of the nation’s largest regions reduced their economic segregation more than Chicagoland did between 1990 and 2010.
Comparing the Nation: Ranking of Segregation in 100 Largest U.S. Metro Areas, 2010
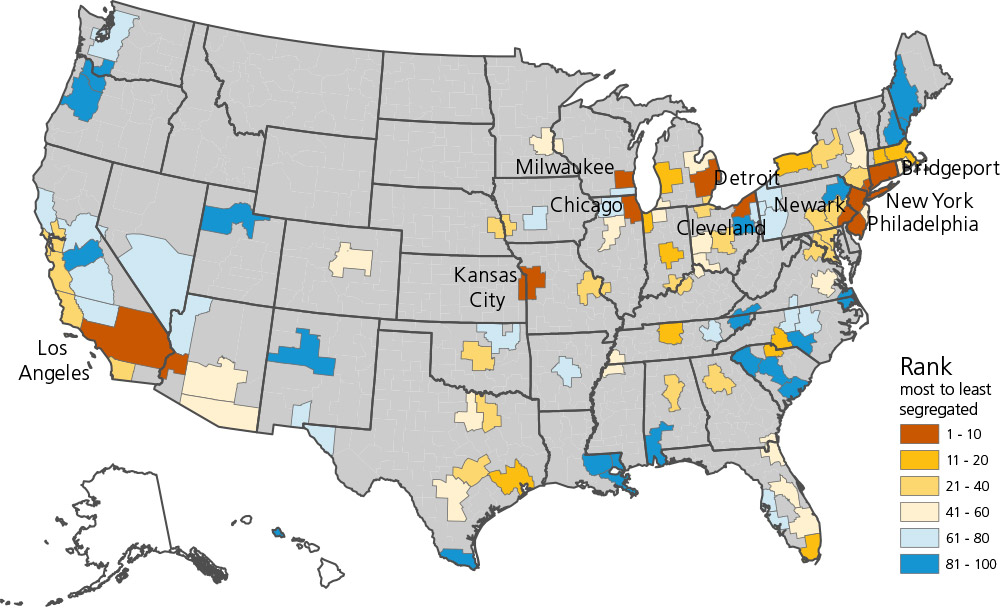
Source: Acs, Gregory, Rolf Pendall, Mark Treskon, and Amy Khare. 2017. The Cost of Segregation: National Trends and the Case of Chicago: 1990–2010. Washington, D.C.: Urban Institute.
The Chicago region has consistently ranked in the top 10 highest levels of African American-white racial segregation from 1990–2010. The findings for African American-white segregation were by far the most pronounced, and so we focus on that measure in this section.
Source: Urban Institute, based on 2011–2015 American Community Survey (ACS) five-year estimates.
Chicago, Philadelphia, Cleveland and Newark are similar in terms of African American-white segregation, population and racial demographics, as well as persistent levels of segregation over the decades. The difference between Chicago and the national median of segregation (the dash line) indicates how far we are from achieving a moderate level of segregation.
Source: Urban Institute, based on 2011–2015 American Community Survey (ACS) five-year estimates.
It is not inevitable that a city and its surrounding suburbs are segregated to the degree that the Chicago region is. Other regions across the country are similar to Chicago in terms of population and demographics, but are more racially integrated among African Americans, Latinos and whites.
Source: The Cost of Segregation, Urban Institute, accessed March 24, 2017.
What does a less segregated region look like?
These maps illustrate where white, African American and Latino people live. Each dot represents 1,000 people. Compare the pattern in Houston, a region with a moderate level of racial segregation, to the concentrated racial segregation of the Chicago region.
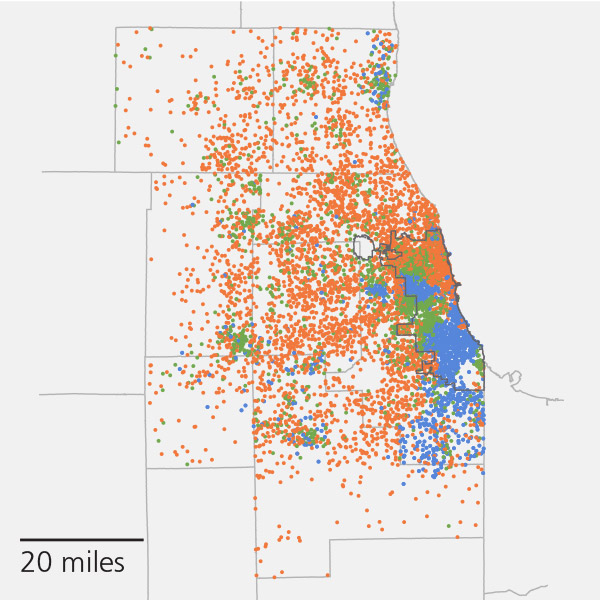
Chicago region: Concentrated racial segregation
1 dot = 1,000 people
Population: 8,505,977
White (52.2%)
African American (17.0%)
Latino (22.4%)
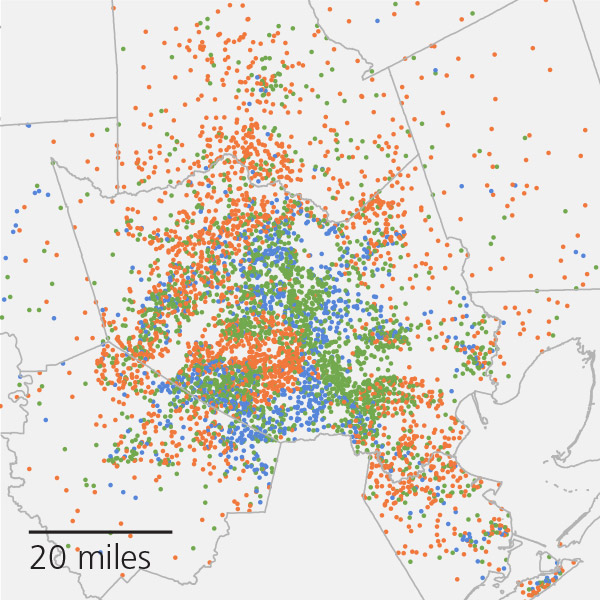
Houston region: Moderate racial segregation
1 dot = 1,000 people
Population: 6,076,171
White (37.8%)
African American (17.0%)
Latino (36.3%)
Source: Maps by MPC, based on Urban Institute map and analysis of 2011–2015 American Community Survey (ACS) five-year estimates
What would it take for Chicago to achieve median levels of segregation?
While Chicago’s economic and racial segregation has decreased modestly since 1990, major drops are needed to reach the national median level of segregation. If we continue desegregating at our current pace, we will not reach the median level of Latino-white segregation until between 2050 and 2060 and the median level of African American-white segregation until between 2060 and 2070. With lost lives, income and potential on the line, we don’t have that kind of time. We need more deliberate interventions to accelerate our progress. Learn more »
Source: Acs, Gregory, Rolf Pendall, Mark Treskon, and Amy Khare. 2017. The Cost of Segregation: National Trends and the Case of Chicago: 1990–2010. Washington, D.C.: Urban Institute.
How segregation impacts Latinos
Across the country and in the Chicago region, segregation between African Americans and whites is more pronounced than it is between Latinos and whites. At the same time, segregation causes unique and often negative impacts to Latinos in metro Chicago that merit further exploration. For instance, Latino household mobility is often the result of displacement caused by real estate speculation rather than the family’s upward economic mobility,[11] Latinos are underrepresented in public housing,[12] and while more suburbanized, they are typically clustered into older de-industrialized and disinvested areas of the region.[13]
Chicago’s two most gentrifying neighborhoods, Pilsen and Logan Square, each lost substantial Latino population from 2000 to 2013 (26 percent and 35 percent, respectively) while gaining substantial white population (22 percent and 44 percent, respectively).[14]
Source: Graph by MPC, based on analysis of 2006-2010 and 2011-2015 American Community Survey (ACS) five-year estimates

While Latinos make up 25 percent of the Chicago Housing Authority’s eligible public housing population, they occupy just 10 percent of available units and only one in ten individuals on waiting lists is Latino.[15]

While the overall Latino population is increasing in the Chicago region, 92 percent of majority-Latino suburbs in the Chicago region lost population between 2014 and 2015, many due to white population loss.[16]

61 percent of all Latino students in the Chicago region attend a majority-Latino school; 78 percent of the students attending these majority-Latino schools identify as low-income.[17]
Segregation in Chicago: causes and effects
Rooted in racism, federal and local policies established racial and economic segregation in the Chicago region. After the start of the Great Migration in 1916, the Chicago Real Estate Board (CREB) instituted racially restrictive covenants that prohibited African Americans from purchasing, leasing and occupying housing outside of a small area on the city’s South Side. These covenants were legal and allowed racially discriminatory housing policies to continue for decades.
The widespread practice of “redlining” in Chicago further exacerbated segregation by denying certain communities access to financial capital and resources. The redlined African American neighborhoods were deemed high-risk to financial institutions, making it impossible or unrealistically expensive to get mortgages or take out loans for small businesses. After World War II, national and local policies helped give rise to two distinct paths: suburban homeownership for whites and massive public housing developments in already overcrowded, disinvested areas for African Americans and later Latinos.
The forces of racial and economic segregation persist today.
Latino immigration and settlement into Chicago grew most significantly beginning in the 1970s. By 1980, more than 60 percent of residents of the Pilsen and Little Village neighborhoods were Latino and by 1990, Logan Square and West Town were largely Latino, as well. From 1990 to 2010, Latinos grew from 6.6 percent to nearly 18 percent of the suburban population, clustered in areas such as Cicero, Aurora and Waukegan; between 2000 and 2010, six majority-white suburbs flipped to majority Latino, including west suburban Berwyn and northwest suburban Carpentersville.
The forces of racial and economic segregation persist today. Current government policies tend to benefit those with existing wealth, such as homeowners who receive federal tax benefits. People of color are disproportionate recipients of predatory loans, even when they have similar or better assets and credit score as whites, in part due to discrimination in the banking and housing industries.[18] Majority white, affluent areas often enact policies that hinder the availability of economic mobility options, such as zoning laws that limit multi-family rental housing or smaller homes that might be more affordable.
Rising income inequality is also a driver of contemporary segregation and has the most detrimental consequences for communities of color because these populations are more likely to be middle to low-income. In short, the current social, economic and political dynamics within the region largely maintain, rather than ameliorate, the inherited segregation of past eras.
The Impact of segregation on people, neighborhoods and regions
Simply put, segregation on the basis of race and class results in inequitable opportunities for education and other public services, job prospects and even health outcomes.
In fact, ample evidence demonstrates the link between concentrations of poverty and negative outcomes for low-income people and the neighborhoods where they live. For example, youth growing up in high-poverty, racially segregated neighborhoods are more likely to experience negative educational outcomes, from reduced high school graduation rates to academic test performance.[19] These early challenges for youth translate to losses in economic advancement over their lives, including stifled opportunities to become homeowners or start businesses.
But does segregation effect entire regions and everyone living within them? While the data is clear about the negative effects for lower-income populations and communities of color, there is growing evidence that metropolitan areas with high levels of segregation suffer from economic impairments as well. Regions with higher levels of inclusion generate more long-term economic growth, while areas with higher levels of segregation have slower economic growth and shorter periods of economic growth.[20]
The “vicious circle of sprawl and economic segregation…imposes significant costs on all parts of metropolitan areas,” according to Dreier and co-authors.[21] The losers include taxpayers living in more affluent parts of metro areas, who must pay for public services to address the effects of segregation, such as the criminal justice and public health systems.
This project fills gaps in the current evidence about the financial cost of segregation for entire regions. It demonstrates that there is a real price to the Chicago region for our high levels of persistent segregation, which is paid in lost income, lives and potential.
Next steps
Future analysis and modeling is needed to gain more understanding about these costs, including how people of different races experience them.
For now, we know that we can create a more robust regional economy by making our city and suburbs less racially and economically segregated. The second phase of this initiative will identify how we can accelerate our rate of desegregation and create a more inclusive, prosperous path forward for all. That work will include developing a projected baseline scenario for the Chicago region that assumes the continuation of our current patterns of racial and economic segregation and an alternative vision that incorporates policy changes in housing, transportation, public safety, health and education.
It’s no longer an option to do nothing. We need to invest in our future by investing in inclusion.
Chicago’s present-day segregation did not occur overnight and it was not a process that occurred “naturally.” Private and public policies and programs built our divides: Restrictive housing covenants. Urban renewal. Redlining. Predatory lending and the massive foreclosures that followed. Illegal discrimination against housing voucher holders. It is not merely by chance that public school quality closely follows the racial composition of the student body, or that after the housing bubble, property values have recovered or even risen in well-to-do, largely white communities while they remain well below for much the South and West sides of Chicago. Our history can point us to our future: Just as we created the status quo, we can tear down these barricades to opportunity and forge a new reality.
We are working with neighborhood groups, local advocates and national advisors to identify the most effective policies and build the political courage to enact them. At the top of our list will be strategies that enable each person to achieve his or her full potential, thereby creating a brighter future for all of us.
Have ideas? Contact MPC at info@metroplanning.org.
Data, measures and methods
There are three major parts to the study:
First, our research partner Urban Institute analyzed segregation in the 100 most populous commuting zones (CZs, which correspond generally with metropolitan areas) from 1990, 2000 and 2010, using Census and American Community Survey data.
To determine the trend and level of segregation in these metro areas, Urban Institute mainly used two indices:
- To analyze economic segregation: The study uses the Generalized Neighborhood Sorting Index (GNSI). The GNSI measures the extent to which people of similar incomes “clump” together within a given metropolitan region.
- To analyze racial segregation: The study measures both African American-white and Latino-white racial segregation using a spatial proximity (SP) index. This explores the extent to which groups cluster together within a region.
Second, the study analyzes the relationships between both economic and racial segregation and CZ-wide outcomes. The analysis considers the effect of segregation for the overall population, whites, African Americans and Latinos. We chose five measures because we could obtain consistent data across three decades and they all capture important societal costs. The five outcomes of interest are:
- Median household income
- Per capita income
- Proportion of residents age 25 or older with four-year college degrees
- Life expectancy of residents
- Homicide rate
Third, the study determines what outcomes the Chicago region would likely have if its level of segregation were to decrease to the median, based on outcomes in CZs near the median.
For more detailed descriptions of the methods, refer to Urban Institute’s report.
Acknowledgments


MPC partnered with the Urban Institute to conduct this research. Urban Institute is a Washington D.C.-based organization that conducts research to understand and solve real-world challenges in a rapidly urbanizing environment. Urban Institute does not take positions on issues. Scholars are independent and empowered to share their evidence-based views and recommendations shaped by research.
Thank you to our dedicated research partners at Urban Institute: Greg Acs, Rolf Pendall and Mark Treskon.
The Chicago Community Trust and the John D. and Catherine T. MacArthur Foundation funded this research. The Chicago Community Trust is a community foundation dedicated to improving our region through strategic grant making, civic engagement and inspiring philanthropy. The MacArthur Foundation is one of the world’s largest independent foundations and supports creative people, effective institutions, and influential networks building a more just, verdant, and peaceful world.
We are grateful for their financial and intellectual support of this project, in particular Ianna Kachoris, Tara Magner, Peggy Davis and Joanna Trotter.
This project has been guided at every step by a committed group of advisors and working groups. Special thanks to:
- Betsy Benito
Corporation for Supportive Housing - Matthew Brewer
MPC Board Member - Rob Breymaier
Oak Park Regional Housing Center - Chris Brown
Southwest Organizing Project - Todd C. Brown
MPC Board Chair - Paul Carlisle
MPC Board Member - Chicago Metropolitan Agency for Planning (CMAP)
- Chris Conley
MPC Board Member - Patricia Fron
Chicago Area Fair Housing Alliance - Andy Geer
Enterprise Community Partners - Angela Hurlock
Claretian Associates - Joe Iaccobucci
Sam Schwartz Consulting - Bernita Johnson-Gabriel
Office of the Mayor, City of Chicago - Rachel Johnston
Chicago Rehab Network - Ianna Kachoris
MacArthur Foundation - Juan Carlos Linares
Latin United Community Housing Association (LUCHA) - Sylvia Puente
Latino Policy Forum - Raul Raymundo
The Resurrection Project - Jay Readey
Metro Alliance - Jennifer Ritter
ONE Northside - Robin Shabes
IFF - Rachel Scheu
Elevate Energy - Paul Shadle
DLA Piper - Geoff Smith
Institute for Housing Studies at DePaul University - Heather Smith
Field Foundation - Joanna Trotter
Chicago Community Trust - Kyle Whitehead
Active Transportation Alliance - Laura Williams and Shumeca Pickett
World Business Chicago - Paula Wolff
Illinois Justice Project
The views expressed in this report are those of the authors and should not be attributed to advisors, funders or MPC board members.
MPC Lead Authors
- Marisa Novara
Vice President - Alden Loury
Director of Research and Evaluation - Amy Khare
Consultant
MPC staff and research assistants
- Emily Blum
- Kendra Freeman
- Chloe Gurin-Sands
- Madeline Shepherd
- Jessica Smith
- Andres Villatoro
- Shehara Waas
Thank you to Mandy Burrell Booth, Breann Gala and Chrissy Mancini Nichols, our former colleagues, who assisted with the creation and curation of this project in earlier stages.
Design
- Ryan Griffin-Stegink
- Webitects
References
- ^ The gross domestic product (GDP) by metropolitan area (or region) is the counterpart of the national gross domestic product (GDP), which is how the U.S. Department of Commerce measures U.S. economic activity (Bureau of Economic Analysis, U.S. Department of Commerce). In our analysis, we drew from the methodology of the National Equity Atlas and per capita gross domestic product figures from the U.S. Department of Commerce to calculate a 1.58 percent rise in the Chicago commuting zone’s gross domestic product with the assumption that a rise in a region’s per capita income produces an equivalent rise in its gross domestic product.
- ^ Florida, Richard, and Charlotta Mellander. “Segregated city: The geography of economic segregation in America’s metros.” Martin Prosperity Institute, (2015); calculations and analysis by the Metropolitan Planning Council
- ^ Reardon, Sean F., and Kendra Bischoff. “The continuing increase in income segregation 2007–2012,” Stanford Center for Education Policy Analysis, (2016).
- ^ Turner, Ani. “The business case for racial equity,” National Civic Review, 105.1 (2016).
- ^ Shapiro, Robert J. and Kevin A. Hassett. “The economic benefits of reducing violent crime: A case study of 8 American cities.” Center for American Progress, (2012); Numbers adjusted to 2016 dollars, calculations and analysis by Metropolitan Planning Council
- ^ Ibid; calculations and analysis by the Metropolitan Planning Council
- ^ Ibid; calculations and analysis by the Metropolitan Planning Council
- ^ Cook, Phillip J., and Jens Ludwig. Gun violence: The real costs. Oxford University Press on Demand, (2000); calculations and analysis by the Metropolitan Planning Council
- ^ Carnevale, Anthony P., Stephen J. Rose, and Ban Cheah. “The college payoff: Education, occupations, lifetime earnings.” Georgetown University Center on Education and the Workforce, (2011); calculations and analysis by the Metropolitan Planning Council
- ^ Bureau of Labor Statistics, “Chicago area employment-November 2016, Local rate of employment growth below national average,” (2016).
- ^ Betancur, John. “Gentrification and community fabric in Chicago.” Urban Studies 48.2 (2011): 383–406.
- ^ Troche-Rodriguez, Madeline. “Latinos and their housing experiences in metropolitan Chicago: Challenges and recommendations.” Harvard Journal of Hispanic Policy, 21 (2009): 17–34.
- ^ Chicago Metropolitan Agency for Planning, “Impacts of Latino population growth on comprehensive planning in the Chicago metropolitan region: Technical paper.” (2008); Also see Roth, Benjamin J. Roth, “Bajo el Mismo Techo The Latino community in suburban Chicago: An Analysis of Overcrowded Housing.” Research Report of Latinos United, (2008); Holloway, Adrienne M. “The minority suburbs: Are low-income Latino households moving into suburban opportunity neighborhoods? A case study of the Greater Chicago region.” Journal of Intercultural Disciplines; Scarborough 15 (Spring 2016).
- ^ Chicago Area Geographic Information Study, Dept. of Geography, University of Illinois at Chicago.
- ^ Chicago Housing Authority, CHA Quarterly Report, 3rd Quarter, 2016.
- ^ Loury, Alden. “Data points: Chicago’s segregation isn’t just in the city,” Metropolitan Planning Council, June 2016
- ^ Fall Enrollment Counts 2015–2016, School and District Summary, Illinois State Board of Education
- ^ Roithmayer, Daria. Reproducing racism: How everyday choices lock in white advantage. New York University Press, 2014.
- ^ Chetty, Raj, Nathaniel Hendren, and Lawrence F. Katz. “The effects of exposure to better neighborhoods on children: New evidence from the Moving to Opportunity Experiment.” American Economic Review 106 (4): 855–902 (2016); Sampson, Robert J. Great American city: Chicago and the enduring neighborhood effect. Chicago: University of Chicago Press (2012); Sharkey, Patrick. Stuck in place: Urban neighborhoods and the end of progress toward racial equality. Chicago: University of Chicago Press (2013).
- ^ Li, Huiping, Harrison Campbell, and Steven Fernandez. “Residential segregation, spatial mismatch, and economic growth across US metropolitan areas.” Urban Studies 50.13 (2013): 2642–2660; Benner Chris, and Manuel Pastor. “Brother, can you spare some time? Sustaining prosperity and social inclusion in America’s metropolitan regions.” Urban Studies 52.7 (2015): 1339–1356.
- ^ Dreier, Peter, John H. Mollenkopf, and Todd Swanstrom. Place matters: Metropolitics for the twenty-first century. Third Edition, Revised. Lawrence, Kansas: University Press of Kansas (2014). Quote from page 58.