Improving Zoning Together: Limited Pollution Exposure Outcome (Part 1 of 2)
Improving Zoning Together: How do zoning and land use affect our exposure to pollution?
Metropolitan Planning Council (MPC) and the Urban Institute are conducting research on how zoning and land use impact Chicago’s neighborhoods and residents from an equity, sustainability, and public health perspective. We are assessing and quantifying the extent to which zoning and changes in zoning have contributed to Chicago’s long-standing inequities across seven priority outcomes: affordable housing, strong business corridors, limited pollution exposure, accessible public transit hubs, productive land use, available groceries and healthcare, and mitigation and adaptation to climate change.
This is the first of a two-part work on pollution exposure. The two-part work is part of a larger blog series titled ‘Improving Zoning Together‘, which explores our research findings based on each of the research outcomes.

In the kick-off blog post to the Improving Zoning Together blog series, MPC shared how we approached the research to explore the outcomes: 1) Understand the outcome; 2) Understand the zoning; and 3) Understand the relationship.

For analysis of pollution exposure, we used this framing to focus on three key questions:
- What is the relationship between pollution exposure and zoning?
- How is the way that land is used in neighborhoods related to pollution in Chicago?
- How does this affect Chicagoans?
Before we get into the nitty-gritty and do a deep dive into the research, here are some high-level takeaways addressing these three key questions:
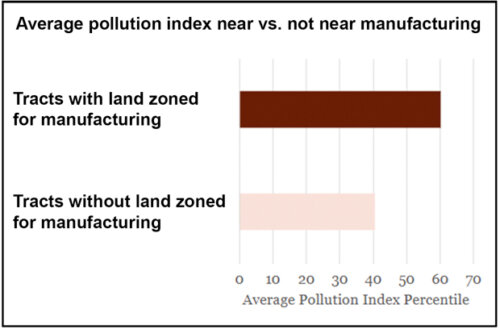
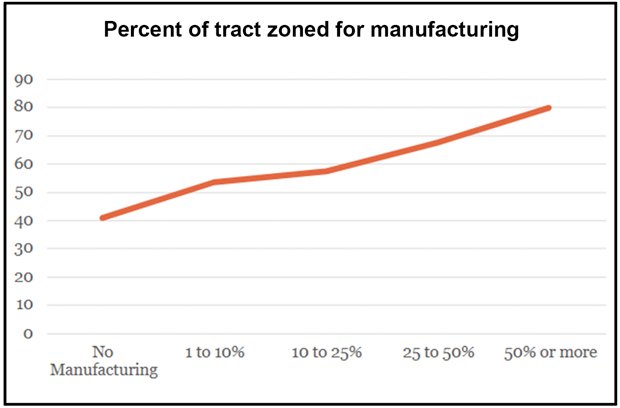
- Areas with manufacturing have higher pollution, on average. Pollution and manufacturing zoning are correlated. This means the areas (we looked at census tracts) that contain manufacturing have higher levels of cumulative pollution on average. And the share of an area being zoned for manufacturing is a predictor of higher levels of pollution exposure—so that as the amount of manufacturing zoning in a neighborhood increases, so does pollution.
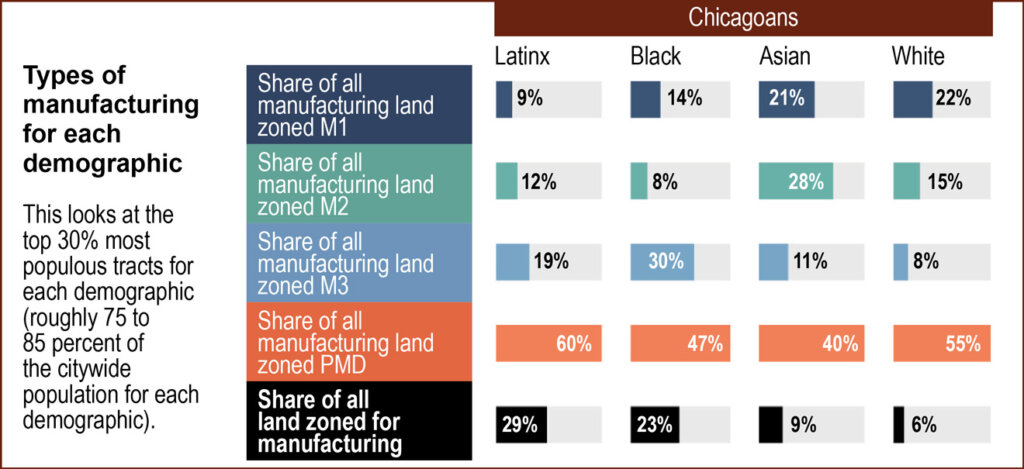
- Latinx and Black Chicagoans experience more of their neighborhoods zoned for heavy manufacturing and manufacturing overall. Manufacturing in areas where most white and Asian Chicagoans are more likely to be zoned for limited manufacturing (M1) or light industry (M2), while manufacturing in areas where Latinx and Black Chicagoans live are much more likely to be zoned for heavy industry (M3).
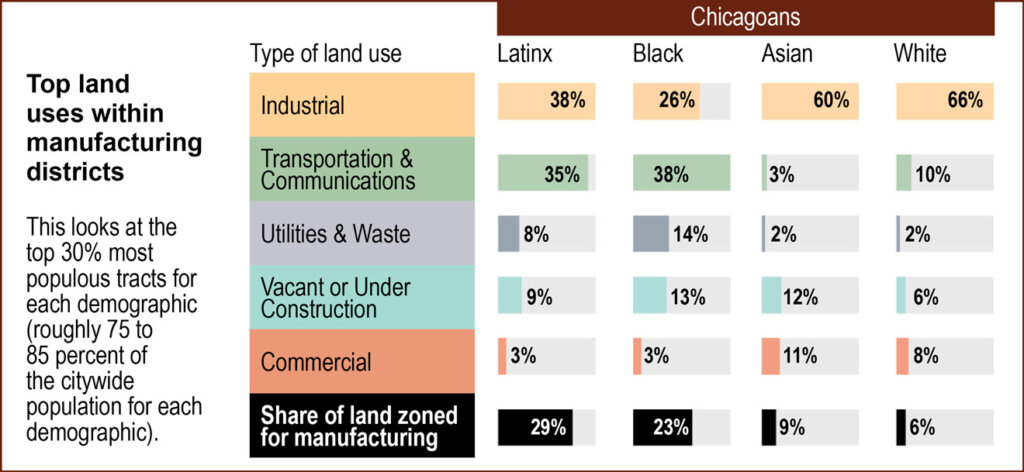
- Latinx and Black Chicagoans are more likely to encounter pollution-emitting land uses. Land uses (how land is actually used and for what purpose) vary across different types of districts zoned for manufacturing. More land uses that are categorized as transportation and communications as well as utilities and waste are located in areas where Latinx and Black Chicagoans live relative to Asian and white Chicagoans. Land uses of this type include railyards, freight and trucking terminals, and landfills. Many of these uses result in both pollution and contamination.
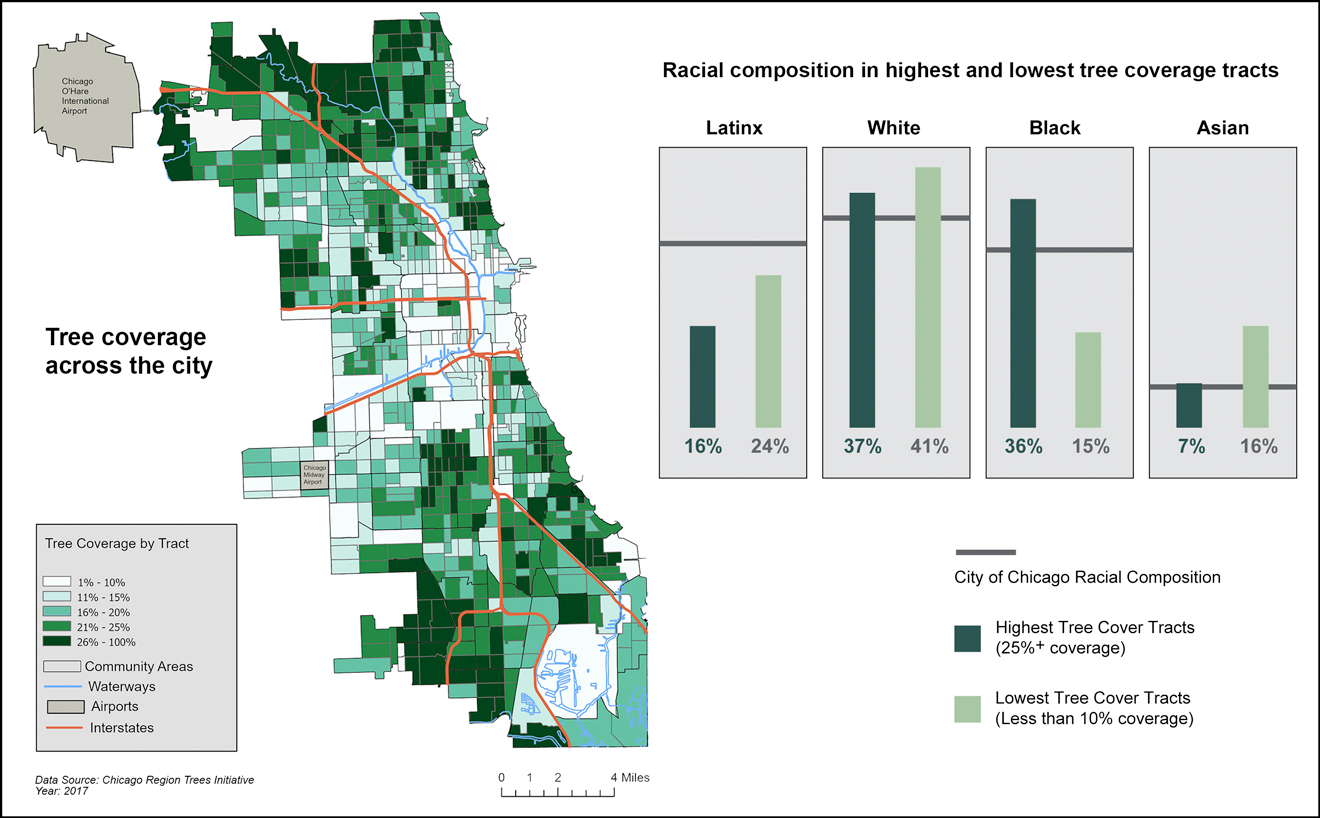
- Tree coverage is sparse in Latinx neighborhoods, which is where pollution concentrates. The parts of the city with higher pollution levels—near downtown, along expressways, and along major industrial corridors—also tend to have low levels of tree coverage. In the areas with the most tree coverage, only 16% of the population is Latinx.
- All Chicagoans breathe unhealthy air, but Latinx Chicagoans are most impacted. Chicagoans are exposed to small particulate air pollution at higher levels across the city than recommended by public health standards. Latinx Chicagoans suffer the most from overall and air pollution exposure—50 percent of the population in the highest air pollution census tracts are Latinx.
Now that we’ve clarified some of our main findings, let’s explore each one of these main questions separately.
What is the relationship between pollution exposure and zoning?
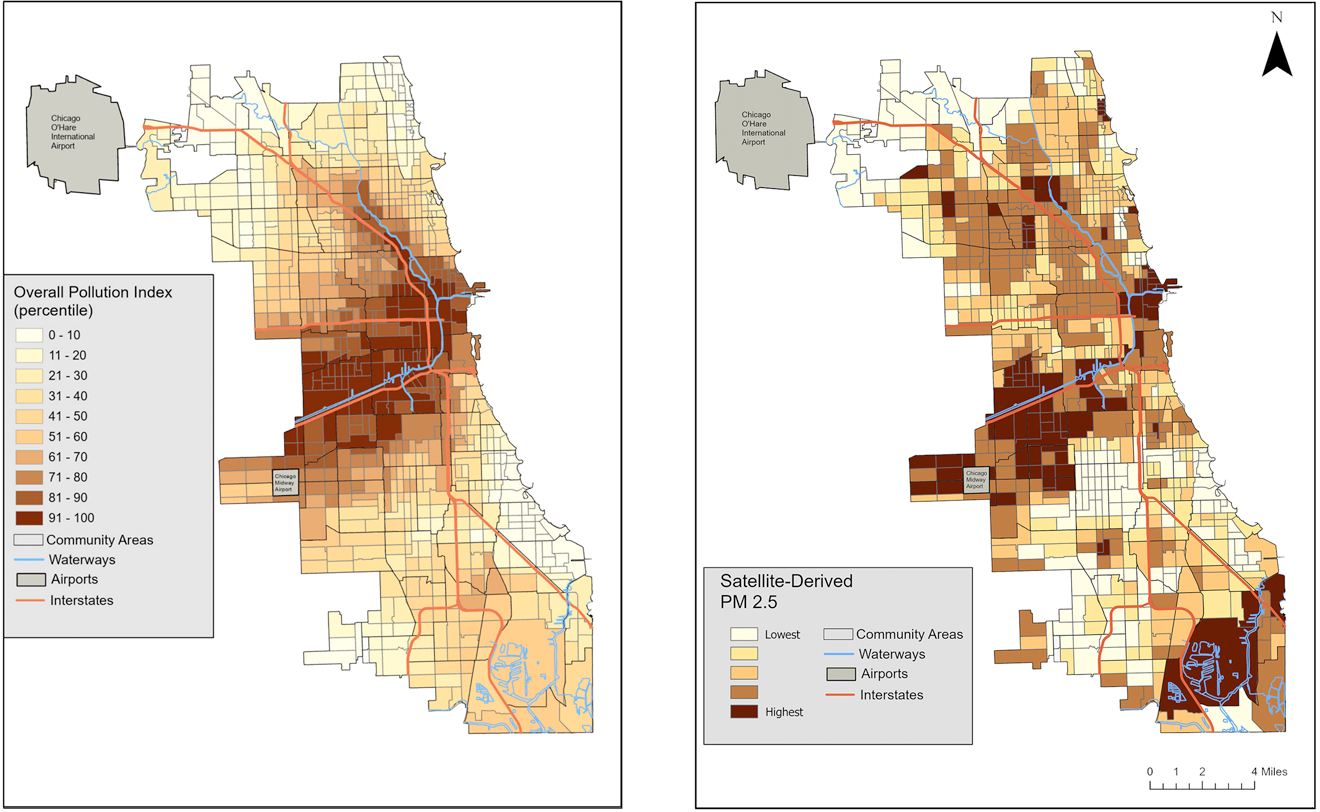
Pollution is the release of waste that contaminates air, land, and water. This research uses two measures of pollution exposure. First, we looked at cumulative pollution exposure. For cumulative pollution exposure, we used data from the US Environmental Protection Agency’s (EPA’s) EJ Screen to combine several measures into a single pollution exposure index to reflect the variety of ways people encounter pollution, from breathing it in to living near a waste site. Second, we looked at air pollution, for which we used satellite-based estimates of PM2.5 levels. PM2.5 is small particulate air pollution that comes from vehicles, industrial emissions, and other sources. Figure 1 shows that we learned that overall pollution is highest near downtown, along expressways and major industrial corridors. Air pollution was similar with levels highest near the downtown but also southwest and southeast sides of the city.
Figure 1
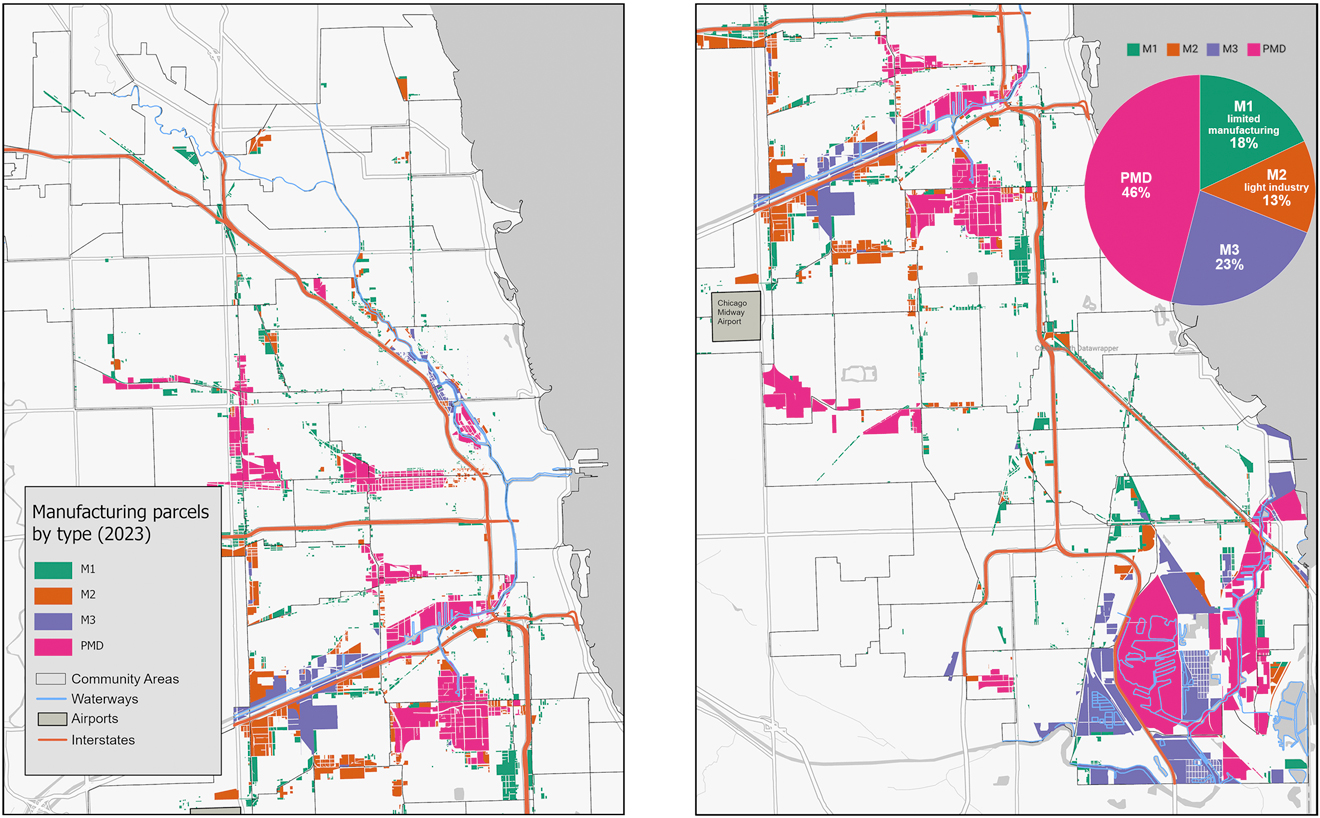
We combined our pollution exposure measures with a focus on manufacturing zoning as our primary zoning district of concern given that these areas contain most of the city’s industrial land and other highly polluting activities and uses in general. The zoning data came from the City of Chicago, and we reviewed both the standard manufacturing zoning districts in the zoning ordinance—M1 (limited, small-scale manufacturing), M2 (light industry, moder impact manufacturing), and M3 (heavy, large-scale industry) zoning—as well as Planned Manufacturing Districts (PMDs). PMDs are similar to other manufacturing districts but with additional zoning laws prohibiting residential development and other specific uses. They can vary widely in terms of intensity of uses and activities within them. Roughly 17% of city land is zoned for manufacturing today and there are 15 total PMDs within larger areas designated as industrial corridors. Figure 2 shows where manufacturing districts and PMDs are located throughout the city.
Figure 2
From reviewing these data sets together and running some regressions, we learned that pollution and manufacturing are correlated and that census tracts with manufacturing have higher pollution, on average (Figure 3). Greater shares of zoning for manufacturing within a neighborhood result in greater exposure to pollution overall in that neighborhood. The index increases as the share of the tract zoned for manufacturing increases (Figure 4). We also wanted to examine how much manufacturing zoning was a statistically significant predictor of higher pollution levels. What we found was that while manufacturing was a statistically significant predictor, so were several other attributes. Ultimately, establishing causality between manufacturing and pollution is difficult to do without accounting for the effects of other factors such as traffic, freight and logistics, intensity of land uses and activities, and many more. More work is needed to better understand pollution at a granular level, and over time.
Figures 3 & 4
How is the way that land is used in neighborhoods related to pollution in Chicago?
Now that we had a broad understanding of how manufacturing zoning and pollution relate to each other at the overall level of the city, we wanted to dive in deeper to evaluate how this type of zoning and accompanying land uses was impacting different demographic groups and communities at a neighborhood level.
By reviewing the pollution exposure and zoning data and maps, we realized that Latinx and Black Chicagoans experience more of their neighborhoods zoned for heavy manufacturing and manufacturing overall. Twenty-three percent of land is zoned for manufacturing in areas where most Black Chicagoans live, while 29 percent of land is zoned for manufacturing in areas where most Latinx Chicagoans live. This compares to only 6% and 9% of land zoned this way in areas where most white and Asian Chicagoans live, respectively. The types of manufacturing different Chicagoans encounter in their neighborhood vary widely across the city. In areas where most Black and Latinx Chicagoans live, the manufacturing zoning is much more likely to be heavy industry zoning—M3 zoning (Figure 5).
Figure 5
Zoning districts tell you what can be built and where it can be built, but reviewing land uses shows what is actually happening on the ground in a community. We used 2020 land use data from the Chicago Metropolitan Agency for Planning to get a better sense of what types of land uses were occurring within the the manufacturing districts. We found that in addition to having more heavy industry in their neighborhoods, Latinx and Black Chicagoans are also more likely to encounter pollution-emitting land uses. As Figure 6 shows, 43% of manufacturing in areas where most Latinx Chicagoans live contain transportation, utilities, and waste uses, while 52% of manufacturing in areas where most Black Chicagoans live contain these uses. This compares to only 5% and 12% of manufacturing land with these uses where most white and Asian Chicagoans live, respectively.
Figure 6
MPC also looked at tree coverage across the city as we know trees are an important land use mechanism for limiting pollution exposure. We found that the parts of the city with higher pollution levels—which as the maps above show are near downtown, along expressways, and along major industrial corridors—also tend to have low levels of tree coverage. Figure 7 shows that tree coverage is also sparse in Latinx neighborhoods. In fact, in the areas with the most tree coverage, only 16% of the population is Latinx.
Figure 7
How does this affect Chicagoans?
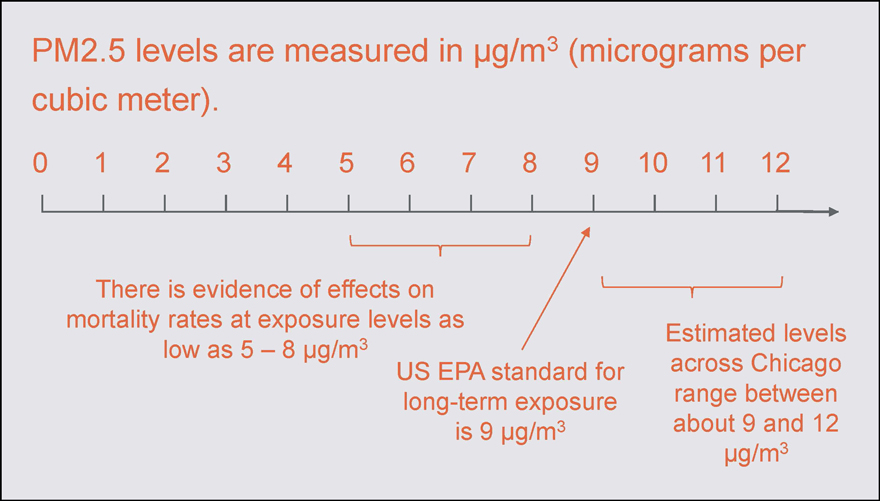
One of the biggest takeaways from this research relates to the set of maps we reviewed that show the different levels of overall and air pollution exposure in Chicago. From these maps, it became obvious that Chicagoans are exposed to PM2.5, at higher levels across Chicago than recommended by 2024 US EPA public health standards for long-term exposure. Estimated levels across the city range between 9 and 12 ug/m3, while the standard is 9 ug/m3 (Figure 8). In other words, all Chicagoans breathe unhealthy air.
Although air pollution is unhealthy all across the city, Latinx Chicagoans suffer the most from both overall pollution as well as PM2.5 air pollution exposure. Though Latinx populations make up 30% of the citywide population, they make up 50% of the population living in the areas with the highest air pollution (Figure 9). They also make up 37% of the population living in areas with the highest overall pollution.
Figure 9

This research matters because pollution impacts the health of everyone, regardless of which neighborhood they call home. As residents, we all move around the city to recreate, work, visit friends, see a show, go shopping, and more. Pollution, particularly air pollution, is not stationary but travels. Just because you don’t live right next door to a factory doesn’t mean you don’t encounter pollution.
The burden of pollution is also placed on certain communities more than others, particularly those living, working, and spending time in areas with manufacturing districts—primarily Latinx and Black Chicagoans. This inequity results in Latinx and lack residents suffering from higher rates of chronic illnesses as pollution can cause lung cancer, heart disease, and asthma—particularly in children. According to the City of Chicago’s 2020 Air Quality and Health report, an estimated 5% of all premature deaths in Chicago can be attributed to exposure to PM2.5 air pollution. No neighborhood, community, or resident should experience pollution at the unsafe levels we have in Chicago.
This blog is part one of two that will explore research findings for the pollution exposure outcome. Part two on pollution exposure will focus on changes to manufacturing zoning over time and what that has meant for other changes in communities. This two-part work makes up one section of the three-part series: Improving Zoning Together, which analyzes data on the effects of land use and zoning on the outcomes of affordable housing, limited pollution exposure, and strong business corridors. Overall, the goal of this research is to first inform and then to make changes. If we find that zoning is having an inequitable, unsustainable, unhealthy impact on residents and communities, we can collaboratively advance needed reforms to change this. For more information about the pollution exposure research, reach out to Kris Tiongson, ktiongson@metroplanning.org
Related Reading
Blog Series: Improving Zoning Together
- Improving Zoning Together: Introductory Blog
- Limited Pollution Exposure Outcome (Part 1 of 2)
- Limited Pollution Exposure Outcome (Part 2 of 2)
- Affordable Housing Outcome (Part 1 of 2)
- Affordable Housing Outcome (Part 2 of 2)
- Strong Business Corridors Outcome
- Accessible Public Transit Hubs Outcome
- Available Groceries and Healthcare Outcome
- Mitigation and Adaptation to Climate Change Outcome


