Think Storms Are Getting Worse? Science Agrees With You

By: Justin Keller
April 22, 2020 / Blogs
April 22, 2020 / Blogs
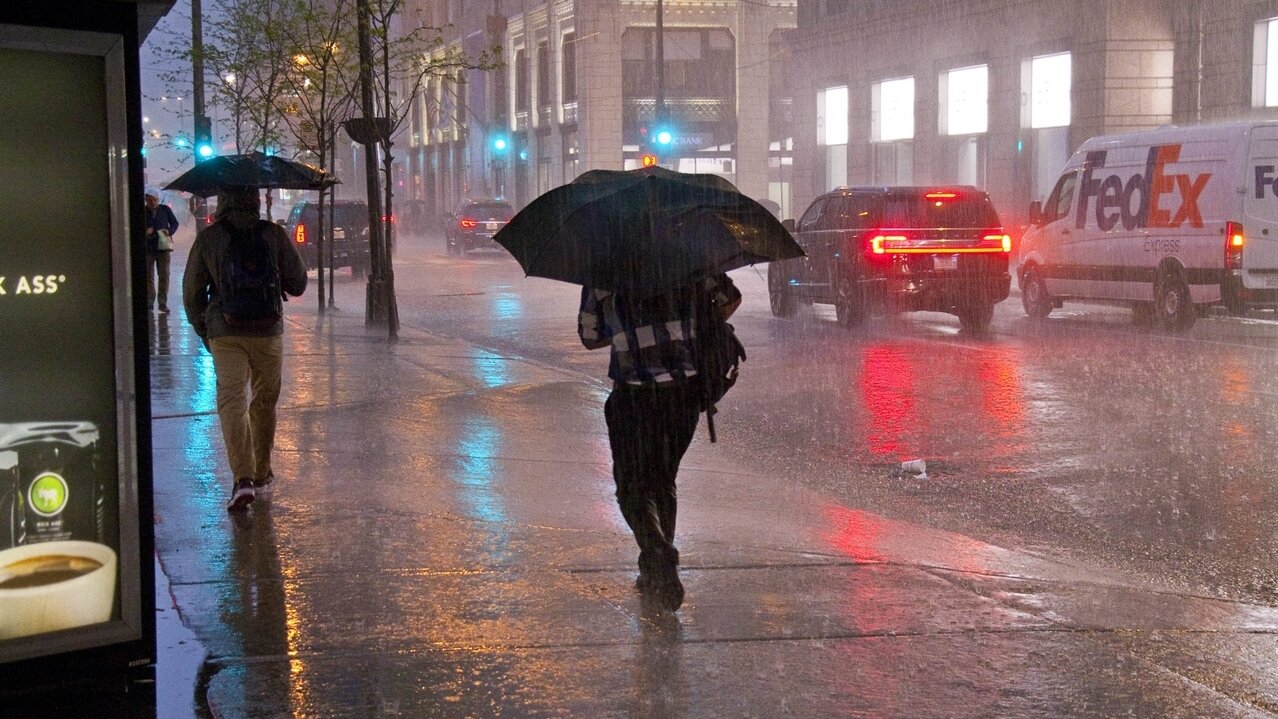
The recent, unprecedented public health crisis has revealed vulnerabilities across Chicagoland. And another stressor we might soon be seeing? Lots of rain, leading to urban flooding and basement back-ups.
Not like the good ol’ days
What’s with all this rain? We seem to ask this question every spring and summer. As a lifelong resident of northeastern Illinois, I am inclined to chalk it up to the old adage, “If you don’t like the weather, wait an hour!” But it seems different than when I was a kid. In recent years, the rain seems to fall all at once, and those storms come more frequently. And apparently it’s not all in my head: data indicates that we’re experiencing a lot more rain, and the trend indicates that we should expect it to continue.
Rainfall data from the Illinois State Water Survey
In 1989, researchers from the Illinois State Water Survey (ISWS) released Frequency Distributions and Hydroclimatic Characteristics of Heavy Rainstorms in Illinois, a report commonly referred to as Bulletin 70. This report provides rainfall values for different probabilities and durations of storm events, ranging from five minutes to 10 days. For example, Bulletin 70 states that a 24-hour 100-year storm event will result in approximately 7.58 inches of precipitation. That’s the amount of rain that should accumulate in a 24-hour period for a storm with a 1-in-100 (or 1%) chance of occurring in a given year.
The document became the standard on which many Illinois governments based their stormwater regulations and ordinances, and it had an impact on development, engineering, design, permitting, research, and more. Thirty years later in March 2019, the former State Climatologist and co-author of Bulletin 70, Jim Angel, and Momcilo Markus from ISWS released a new report with the ISWS designation, Bulletin 75. This new report reflects higher rainfall values experienced since the first report was released, and their analysis gave additional weight to more recent data to better represent the current, wetter climate.
The new figures show that we should prepare for a lot more rain. Using the same example, the new data suggests we should expect nearly an additional inch of rainfall for a 24-hour 100-year storm event (8.57” instead of 7.58”). Regulations across northeastern Illinois are being updated to reflect the new data, and developers will be required to hold or detain a lot more stormwater on-site.
Q & A with Dr. Markus
Why did Illinois need to reassess its numbers? What was the impetus for you undertaking this work?
The intensity and frequency of rainfall events in the Chicago area have been increasing since the beginning of the 20th century, the time when we started collecting rainfall data at several key gages in Chicago and other areas. The relatively dry period in the early 20th century was followed by much wetter sequences in the late 20th and early 21st centuries.
The standards used for sizing the drainage infrastructure (sewers, culverts, etc.) and flood protection infrastructure (levees, berms, etc.) were based on the Technical Paper 40 (TP-40), published in 1961 by the U.S. Weather Bureau. As this standard was based on unusually dry years, the drainage infrastructure was insufficient to convey larger amounts of water during large storms later in the 20th century and in the 21st century. This explains why we experience such frequent flooding in the Chicago area. Bulletin 70 (1989) provided accurate numbers for that time, but the trend of heavier precipitation has persisted, causing even more frequent flooding. This increased frequency in flooding prompted a new study to update the original Bulletin 70.
In layman’s terms, how do the new storm definitions compare to the old? What would those changes look like to people experiencing them?
Storms statistics are determined based on observational data. We design our drainage infrastructure based on what we have seen in the past. One of the frequently used statistics is a 24-hour 100-year event. However, due to the increasing trends in heavy storms, this statistic changes with time. For example, the 24-hour 100-year event for northeast Illinois in TP-40 was between 5.5” and 6”. The same statistic in the original Bulletin 70 and updated Bulletin 75 were 7.58” and 8.57”, respectively. As a result of this change, the TP-40 estimate of the 100-year event is roughly a 15-year event according to Bulletin 75.
What is the significance of this new data? What should we (e.g., state and local government, businesses, residents) do?
Continuous precipitation monitoring is critical in detecting changes, and determining new statistics. The new data reflect increases in precipitation in the recent several decades. Moreover, climate models suggest that this trend will persist and that we will have even more intense and frequent storms in the future. The capacity of the drainage structures built today, designed using the current standards, may become insufficient in the future because the present standards will be exceeded by the new ones. Consequently, flood risk in the future will be higher unless design standards are modified to reflect climate change. This task is, however, very challenging because future projections are uncertain, and it is hard to pinpoint the exact precipitation statistics for future time horizons, such as 2050 or 2100.
The increasing trends in flood risk have to be translated into additional safety for structures, but future projected rainfall frequencies are uncertain, making it difficult to incorporate them into the design of drainage or flood protection infrastructure. Scientists and practitioners need to develop methods for balancing the costs of under-preparing versus over-preparing for future floods.
This challenging problem will require complex analyses and a team of research, engineering, social and economic professionals. Other measures such as green infrastructure may alleviate the problem and should also be considered.
Your expertise includes the hydrologic effects of climate change. What are some positive changes you’ve seen over the course of your career?
Throughout your career you work hard, produce high-quality research and communicate your results. More importantly, for an applied researcher, it is critical to understand the needs of those who will be applying your results, such as communities and consulting businesses.
With time, your work becomes more recognized, and scientific facts are eventually accepted. Sometimes, it takes time. Public awareness about climate change is much higher now than in 1989, over 30 years ago, when the original Bulletin 70 was issued. Consequently, defending the new higher standards is easier now than 30 years ago.
Example: April 2013 storm event
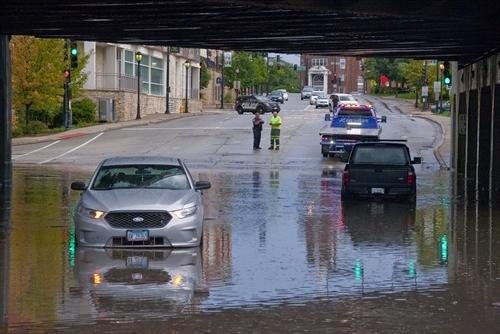
To help ground this in a real-life example, a major storm event occurred in April 2013 which caused flooding throughout northern and central Illinois. According to the U.S. Army Corps of Engineers post-flood report, “Beginning on April 18, 2013, rain gauges from Cook County and the U.S. Geological Survey (USGS) recorded 3.62 to 6.84 inches throughout a 24-hour period.” (Different areas received different amounts of rain.)
Based on the rainfall frequency tables in Bulletin 75, those local rainfall figures ranged from a 24-hour 2-year storm to a 24-hour 25-year storm for northeastern Illinois. If it were a 24-hour 100-year event, that would have meant even more rain and, of course, more flooding. Even without being a 100-year event, the April 2013 storm resulted in a Federal Emergency Declaration (FEMA-4116-DR), and hundreds of millions of dollars in federal assistance was dispersed by the Federal Emergency Management Agency and U.S. Department of Housing and Urban Development.
Wetter weather is here to stay
The Fourth National Climate Assessment found rapid warming in the Midwest since the 1960s. This has resulted in 10-15% increase in annual precipitation between 1986 and 2015, which equates to an additional month’s worth of precipitation each year. Wetter conditions and more heavy rain events will have impacts on agriculture and human health, and stormwater management infrastructure (as well as transportation networks and other critical infrastructure) needs to adapt.
Wetter weather is already here, and more is coming. Are we ready?
Dr. Momcilo Markus is a principal scientist/hydrologist at the Illinois State Water Survey, faculty member at the Department of Agricultural and Biological Engineering and the Department of Natural Resources and Environmental Science at the University of Illinois, and a Fulbright specialist. His current work includes studies on past and projected climate changes, and their effects on rainfall frequency and urban flooding.