Lens on the Calumet Corridor | Limited Healthcare Access Magnifies the Impact of Environmental Pollution

By: Christina Harris
December 3, 2021 / Blogs
December 3, 2021 / Blogs
The Calumet Corridor not only suffers higher rates of chronic disease than other Chicago communities, a federal agency names the area “medically underserved.” Around these industrial riverfronts, people struggle to get the care that they need.
An environmental justice collaborative in Southeast Chicago spent two years studying the lasting health impacts of industry in their community. Lens on the Calumet Corridor: A blog series highlighting the research in the Calumet Connect Databook captures what they discovered, and why it’s time for a change. This is the fifth blog in our six-part series.
In our last post, we explored the increase in chronic disease prevalent in the Calumet Industrial Corridor study area, particularly chronic obstructive pulmonary disease (COPD) and heart disease. These increased health concerns indicate a need for abundant availability of primary healthcare services in the area. However, our research discovered that a significant gap in accessible and comprehensive healthcare services persists within the study area.
Our team created a map of data available from the Health Resources Services Administration (HRSA), which revealed that a majority of the corridor study area qualifies as a “medically underserved area.” A Medically Underserved Areas (MUA) is a government-recognized designation used to identify communities that have a shortage of primary healthcare services or providers to meet the needs of the population living within the area. A Medically Underserved Population (MUP) is a specific sub-group of people living in a defined area that has a shortage of primary healthcare services. These groups may face barriers to healthcare including economic, cultural, and linguistic challenges. (1)
To compare the accessibility of healthcare services over time, we conducted a spatial analysis using asset-based health services compilation data from MAPSCorps, provided from 2009, 2012, 2015, and 2018. This compilation contained addresses of businesses and organizations on Chicago’s South and West sides. We mapped the spatial distribution of health services (alternative medicine, ambulance, chiropractor, counseling, dental, emergency room, hospital, out-patient, therapy, vision, and others) within our study area (see Figure 1). This analysis revealed that, in general, the number of health services increased from 15 health assets in 2009 to 43 in 2018. We did observe that this change did not represent sustained growth—from 2015 to 2018, the number of health assets decreased by seven. The categories of out-patient and dental services experienced the largest growth.
Despite the increase in healthcare services in the Calumet Industrial Corridor study area since 2009, our examination of HRSA’s Medically Underserved Areas and Medically Underserved Populations shows that substantial portions of the community remain medically underserved (see Figure 2). A majority of the study area is designated a Medically Underserved Area, signaling that the residents of the study area have a shortage of primary healthcare services.
Comparing the 2018 Health Assets map with the Medically Underserved Status map indicates that, even though health assets are located within the study area, the people living near these health assets are still experiencing barriers to accessing those services.
Figure 1. Comparison of 2009 and 2018 distribution of health service providers across the Calumet Industrial Corridor

Note: Maps were retrieved from the Calumet Connect Databook, pages 195 and 197, Figures 88 and 89
Figure 2. Medically underserved areas and populations within the study area
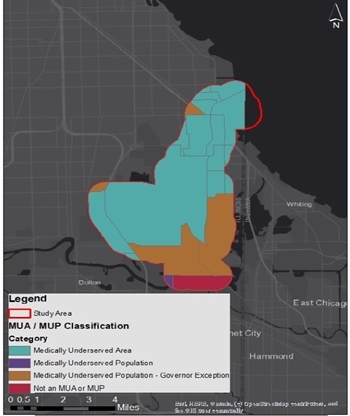
Note: Map was retrieved from the Calumet Connect Databook, page 201, Figure 91
The limited number of healthcare facilities within or close to the study area presents additional hurdles for community residents. For starters, increased travel distance to a doctor may limit a patient’s ability to see her physician as necessary—especially if her modes of transportation are constrained—which is the case within the Calumet Corridor. Transit is limited in the area, according to the River Communities Planning Framework created by the UIC Great Cities Institute (GCI). In GCI’s community outreach, residents noted that the transit routes can feel unsafe and that many drive to Indiana for services as it is more convenient than utilizing public transportation. Other issues voiced by residents include poor sidewalk quality and flooding. Additionally, qualitative study participants tied the unreliability of the bridges as a source of acute stress when traveling. When taken together, varying physical abilities, lack of accessible public transportation, economic pressure, and insurance coverage constraints cause persistent complications, hindering residents’ abilities to address their healthcare needs, thereby affecting their long-term physical and mental health.
Forgoing care further exacerbates chronic ailments and puts patients at risk for avoidable disease-related complications. As the COVID-19 pandemic revealed, and as we’ve long known, safe access to primary health facilities is critical, especially for those with preexisting conditions, who are more at risk for exposure to the disease and severe outcomes due to systemic factors such as industrial pollution, inadequate public transportation, and poverty, to name a few. When looking at the total per-capita COVID-19 deaths by Chicago neighborhoods, communities on the Southeast side are being hit hard, especially Calumet Heights which has the largest average number of deaths within the city.
We are left with this question: what is the cost of these health accessibility disparities? When speaking of cost, we refer to the broadest possible definition: the cost of taking sick days to see a doctor; the cost of allocating additional resources such as time and finances to see a practitioner; and most importantly, the cost of not getting care.
We need public officials in charge of land use and transportation policy to adopt an equity lens that prioritizes addressing the physical barriers in healthcare accessibility that exist on the Southeast side.
Want to get involved?
https://www.claretianassociates.org/
Endnotes
The HRSA creates these classifications based on their Index of Medical Underservice. This index has a 0 to 100 scale, with 0 indicating areas that are completely underserved, while on the other extreme, 100 indicates best-served areas, in terms of access. An area or population’s Index of Medical Service is determined by the sum of the following four weighted indicator values: the population to healthcare provider ratio, the percent of the population below the federal poverty level, the percent of the population over age 65, and the infant mortality rate. An index of 62 or less qualifies an area or population as being medically underserved.
References
https://hpsa.us/services/muaps/medically-underserved-areas-populations-muaps/
https://www.healthypeople.gov/2020/topics-objectives/topic/Access-to-Health-Services
https://southsideweekly.com/live-can-determine-health-note-april-2020/