Lens on the Calumet Corridor | Chicago Riverfront Industrial Corridor Is a Hot Spot of Environmental Racism

By: Christina Harris
June 29, 2021 / Blogs
June 29, 2021 / Blogs
Data reveals years of code violations, high-risk businesses, and lax enforcement

An environmental justice collaborative in Southeast Chicago spent two years studying the lasting health impacts of industry in their community. Lens on the Calumet Corridor: A blog series highlighting the research in the Calumet Connect Data Book captures what they discovered, and why it’s time for a change. This is the third blog in our six-part series.
History repeats itself. Residents of the Calumet Industrial Corridor are disappointed and angry to once again join a cyclical narrative that puts them on the challenging end of industrial land uses. Companies that present pollution risks move into the community, lax enforcement fails to protect residents, code violations pile up, and neighbors’ health suffers—shown by elevated rates of certain chronic disease.
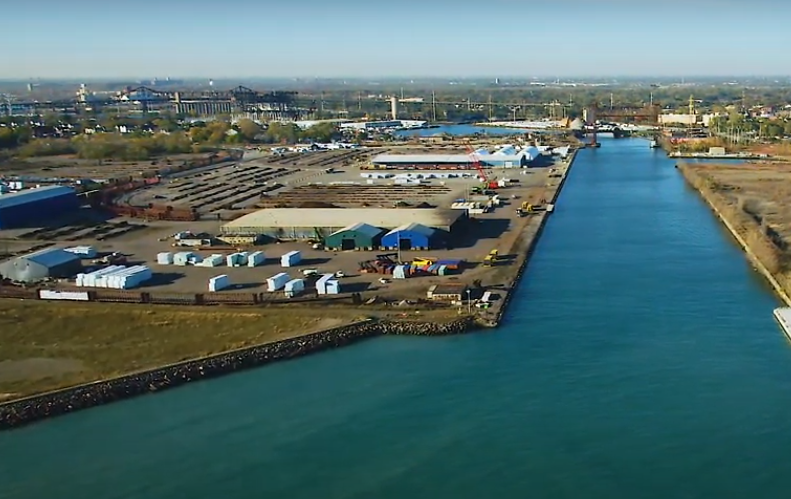
Chicago’s Calumet Industrial Corridor hosts most of the Calumet River’s waterway-oriented industrial activity—a decades-long legacy that has heavily industrialized the Southeast Side. Existing industries in and surrounding the Corridor have a well-documented history of generating air, soil, and water pollution that significantly compromise the quality of life of community residents.
So what is it like to live next to a pollution-generating industry? A partnership of organizations recently worked together to better answer this question through both data and lived experience.
This collective captured their work in the Calumet Industrial Working Group’s Data Book. The quantitative data illuminates and helps clarify public health challenges from a numbers perspective, while the qualitative data provides insights, feedback and input from resident stakeholders on what living within the Corridor is like for them. This post will use quotes from resident focus groups to ground their understanding of the neighborhood and current events.
“… we’re still fighting another dumpsite that wants to come from the North Side over here because we’ve got seven. They’re trying to get rid of one and put it over here like we’re nothing but dead bodies over here already.” —Calumet Corridor resident
As the specter of relocating General Iron, a metal-shredding operation, from the North Side in Lincoln Park to the Southeast Side continues to loom large, many residents feel that the decision to move the facility from a predominantly white neighborhood to a Latinx community once again illustrates a disregard for public health and environmental justice on the Southeast Side, where many residents often feel their community is treated as a dumping ground for the rest of the city. The location of multiple industries like American Zinc Recycling Corp and PVS Chemical Solutions, in a relatively small footprint has real-life implications for families, particularly for outdoor exposure and well-being. As one focus group participant recalled:
“…when her kids are playing outside it smells, the smell is so strong that they have to—they have to run inside because they’re smelling that. And make sure the windows are closed too.” —Calumet Corridor resident
The odors are but one of the challenges of living in an area with concentrated industries and represent one path of exposure. The Calumet Data Book provides information on the type and quality of the pollutants present in the Corridor. Let’s look at some of the data to see what it reveals about the impacts of industries in the Calumet. Through an analysis of data from a variety of sources including the U.S. Environmental Protection Agency’s (EPA)’s Risk Screening Environmental Indicators (RSEI) model, the EPA Toxics Release Inventory (TRI), the City of Chicago Department of Buildings violations, and the Occupational Safety and Health Administration (OSHA) violations, our study revealed industry sectors and specific companies that persistently contribute to pollution on the Southeast Side.
Transportation equipment- and metal-related businesses pose a high risk
Mobilized by national events and a rise in scientific research on the importance of understanding industrial cumulative impacts (i), the EPA established the Risk Screening Environmental Indicators (RSEI) model in 1997. RSEI scores are used to highlight companies and toxic releases that could pose greater risk to public health over a lifetime of exposure. A low RSEI score (ii) indicates low potential concern from reported Toxic Release Inventory releases, while a high RSEI score indicates the opposite.
Based on our analysis, in 2007 and 2012 “Transportation Equipment” was the corridor industry sector with the highest RSEI scores; Ford Motor Company and Tower Automotive had the highest company scores within this sector. In 2017, the “Primary Metals” sector had the highest RSEI scores with American Zinc Recycling Corp, Atlas Tube, Inc., Nacme Steel Processing LLC having the highest company scores.
North American Industrial Classification System (NAICS) (iii) Industry median RSEI scores in 2012 and 2017 revealed that “Automobile Manufacturing” and “Secondary Smelting” sub-sectors had the highest median industry scores overall. Ford Motor Company and American Zinc also belong to these sub-sectors, respectively. Per our qualitative study, the Ford Motor Company was mentioned several times as being a place where residents “saw pollution” and/or associated that pollution with health issues.
Hundreds of hazardous materials violations
From the unsafe release of toxic materials to potential improper employee exposure to hazardous materials, contamination makes a big impact in the Calumet Corridor. We traced a paper trail.
City of Chicago Department of Buildings Violations
Using the City’s Building Permit and Inspection Records Search portal, we compiled data for 91 (iv) companies, collected by the Department of Buildings for violations issued during building inspections between April 1, 1995 and May 3, 2019. Of these 91 companies, 34 total had violation records over the time period we analyzed. Over the 24-year period of analysis, there were 791 total recorded violations. Ford Motor Company was #1 with 123 violations followed by PVS Chemical Solutions with 86 violations.
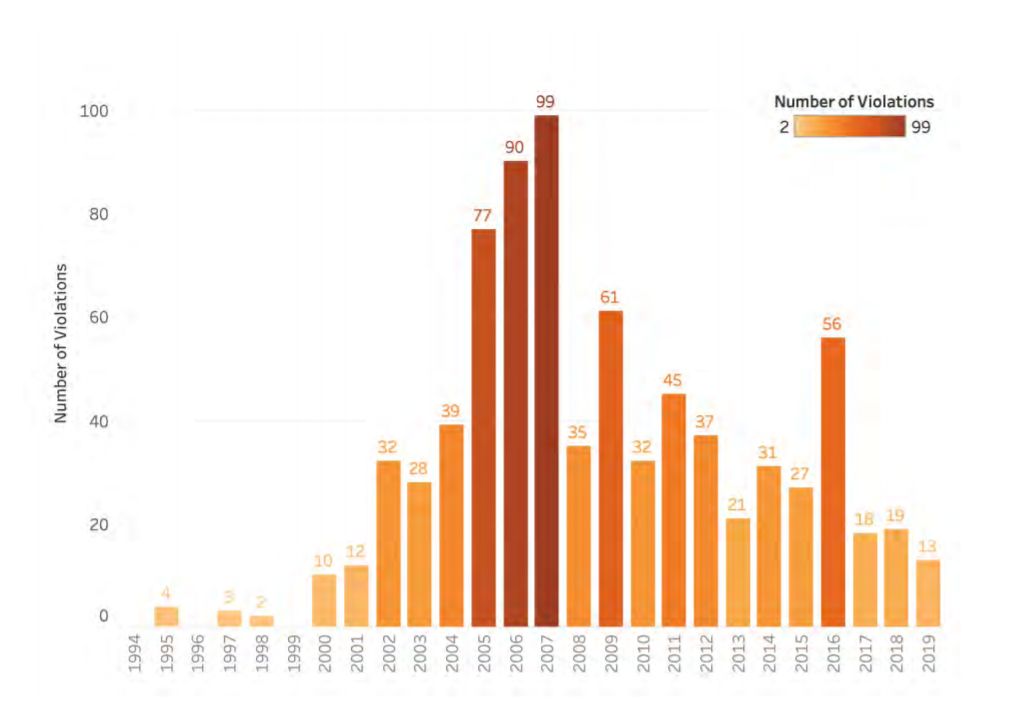
Calumet Connect Databook page 127, figure 58.
Figure 1: Number of violations by inspection year.
It should be noted that in recent years, the number of violations issued by the City’s Department of Buildings to companies in the study area was quite low; while in 2016, 56 violations were issued, only 18, 19, and 13 violations were issued in the years after. Given buildings require inspections “as often as deemed necessary” by the fire commissioner or buildings commissioner, we suspect that a lack of frequent inspections is the primary cause for the decrease. Therefore, the absence of alleged violations does not necessarily mean a building or property is/was in compliance with the requirements of the municipal code.
Occupational Health and Safety Administration (OSHA) Violations
In 1971, the U.S. Department of Labor’s Occupational Health and Safety Administration (OSHA) developed a set of laws and regulations for workplace safety. As part of enforcing these regulations, OSHA inspects high-hazard industries and cites any violations that they may come across. The violation records are made publicly available via the Integrated Management Information Systems (IMIS) database, a central hub for data on various inspection cases, as well as penalty information.
Of the 91 companies that we researched using the IMIS database; 17 had records of OSHA violations in the past ten years with a combined total of 71 initial violations of OSHA rules; 70% percent of these were classified as “serious” (v) by inspectors. Common violations included such things as, employee lead exposure, lack of procedure guidelines for hazardous material exposure, and improper storage and maintenance of hazardous materials.
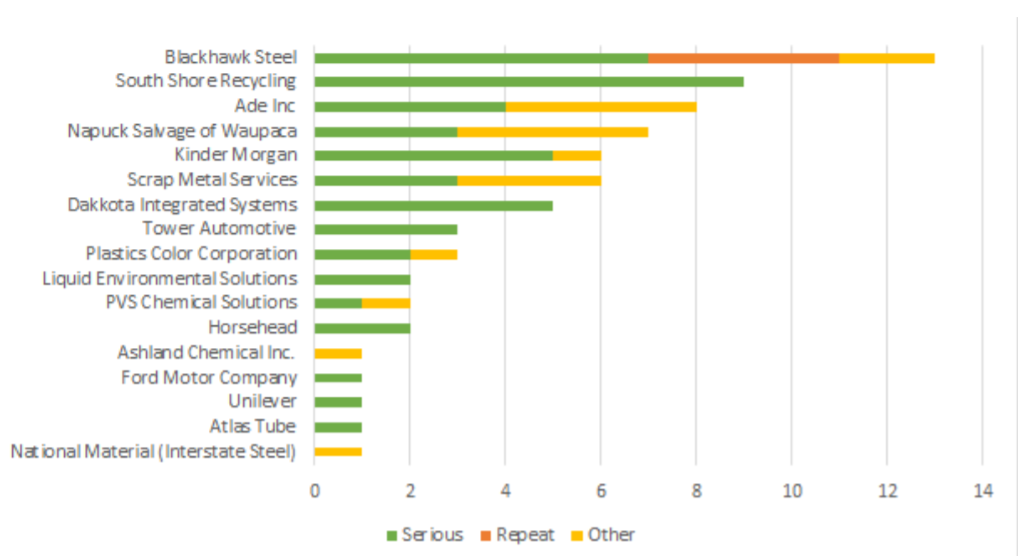
Calumet Connect Databook page 138, figure 69.
Figure 2: OSHA violations by category for Calumet Industrial Corridor businesses.
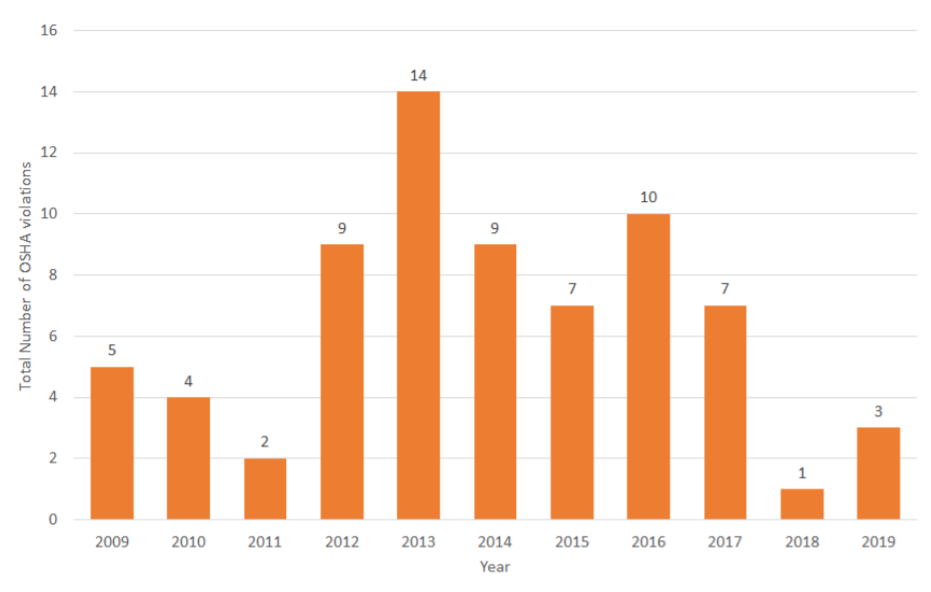
Calumet Connect Databook page 139, figure 70.
Figure 3: Total number of OSHA violations by year.
A lack of accountability and enforcement
The Chicago Department of Public Health (CDPH), as of 2012, is responsible for inspection, permitting, and enforcement as was previously under the purview of the Department of Environment (DOE). In 2019, the City’s Office of Inspector General completed an audit assessing CDPH’s air pollution permit and inspection program, and found that the department was failing to enforce its air pollution standards. The report concluded that, “CDPH’s air pollution permit and inspections programs are increasing the risk that facilities emit more pollution than allowed by law.”
Impact
As a result of lax enforcement, the Southeast Side is home to what the Natural Resources Defense Council calls an “environmental racism hot spot”. Air pollution contributes to increased risk of chronic disease, which is the leading driver of Chicago’s nine-year life expectancy gap between Black and White residents and decreases in life expectancy in the Latinx population. The Air Quality and Health Report found that “air pollution disproportionately burdens neighborhoods on the South and West Sides, with parts of the City bisected by major highways and high concentrations of industry facing significant impacts.”
These impacts did not happen by chance. They are the result of accumulated policy decisions that have prioritized economic development at the expense of public and environmental health . Economic development and environmental justice are often pitted against one another. However, they are capable of coexisting and working in unison to align with citywide and community values.
Want to get Involved?
https://www.claretianassociates.org/
Former MPC Resarch Assistant Chloe Nunez contributed to this post.
End Notes
(i) Cumulative impacts – the compounding of the effects of all actions over time.
(ii) RSEI – The RSEI is a model developed by the EPA to provide context for a facility’s toxic release inventory (TRI) profile. This model considers every TRI facility’s release i n terms of the size of the chemicals, the size and location of the exposed population, and the chemical’s toxicity.
(iii) NAICS – are codes that can be broken down by industry sector/group (which is the most broad categorization), followed by the industry subsector, and then primary NAICS Code, which is the most specific categorization level
(iv) The 91 companies came from the Souteast Chicago business list compiled by the Chicago Center for Health and Environment (CACHET).
(v) Serious – OSHA defines ‘severe’ when a workplace hazard can cause life threatening illness, accidents, serious physical harm or death.
References
https://igchicago.org/wp-content/uploads/2019/09/CDPH-Air-Pollution-Enforcement-Audit.pdf
https://www.nrdc.org/stories/environmental-justice-chicago-its-been-one-battle-after-another