Geographic Equity of Transit Service

By: Thomas Bamonte

By: Hugo Coronado
February 7, 2025 / Blogs
February 7, 2025 / Blogs
The distribution of transit service among the six counties in the Chicago region
In its 2008 reforms to the Regional Transportation Authority (RTA) Act the General Assembly adopted a goal of developing an “adequate, efficient, geographically equitable and coordinated regional transportation system.” (70 ILCS 3615/1.02) The purpose of this post is to explore the geographic distribution of fixed-route public transit service among the six counties that make up the metropolitan region served by the RTA and three transit service providers, the Chicago Transit Authority (CTA), Metra Commuter Rail (Metra), and Pace Suburban Bus (Pace).
Transit Service Measures
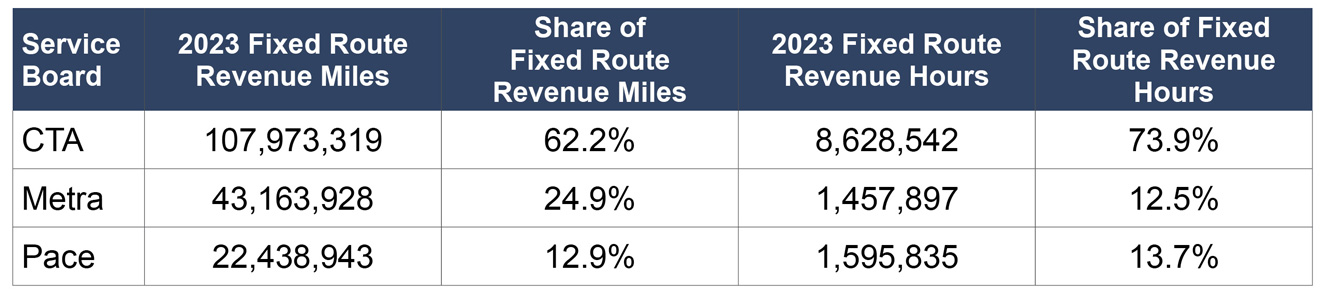
The Federal Transit Administration collects data about transit service levels in a National Transit Database (NTD) and publishes Transit Agency Profiles that include information about the quantity of service provided by each transit agency. The NTD uses two measures for the service supplied by a transit agency. The first measure is Annual Vehicle/Passenger Car Revenue Miles. This is the number of miles transit vehicles cover when providing transit service. The second measure of the service supplied is Annual Vehicle/Passenger Care Revenue Hours. This is the number of hours transit vehicles were providing service. The latest available NTD transit agency profiles are from 2023 and show the following distribution of fixed-route transit service provided by the service providers in the Chicago region:
Transit Service by County
The distribution of fixed-route transit service by service provider does not answer the question of where service is actually being supplied. This is because Metra and Pace operate service in all six counties in the RTA’s service region, Cook County plus the five collar counties: DuPage, Kane, Lake, McHenry, and Will Counties.
To get a rough approximation of the level of Metra and Pace service in each of the six counties, MPC looked at each Metra and Pace route and determined the mileage of each route by county. For Pace, MPC determined the mileage of transit vehicle service supplied for each route (route mileage times number of runs) and then allocated the service mileage by county. For each Metra route MPC multiplied the mileage by county by the number of runs on the route to derive the service mileage by county. The MPC analysis found the following distribution of service mileage for Pace and Metra:
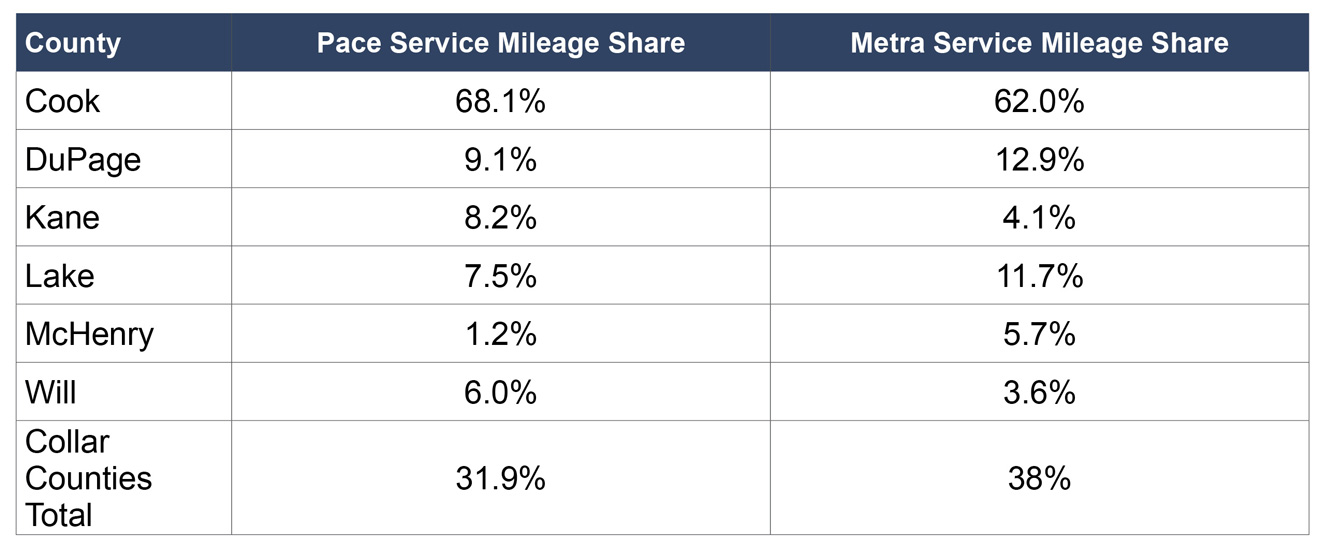
CTA service is confined to Cook County so 100 percent of its service mileage is attributable to Cook County.
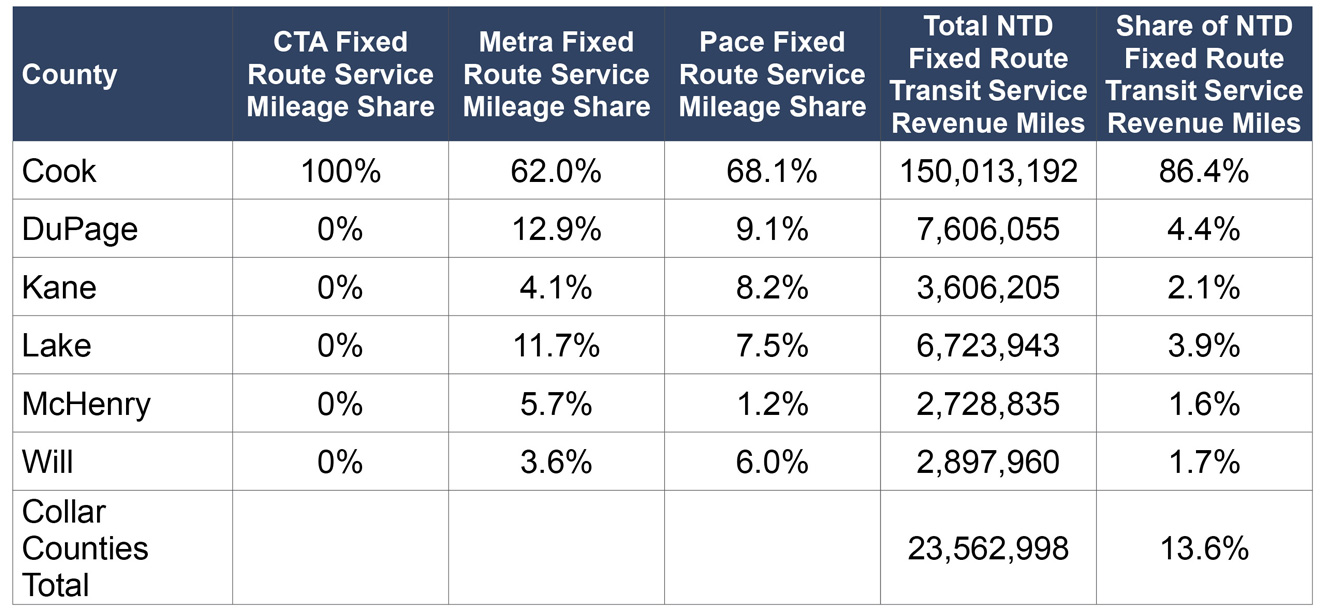
If we apply these service mileage percentages against the NTD Fixed Route Revenue Miles for 2023 (see above) we get the following allocation of transit service mileage among the counties in the region:
Implications
Transit Service vs. Transit Ridership Shares
This approximate distribution of transit service across the six-county Chicago region can be mapped against other pertinent data:
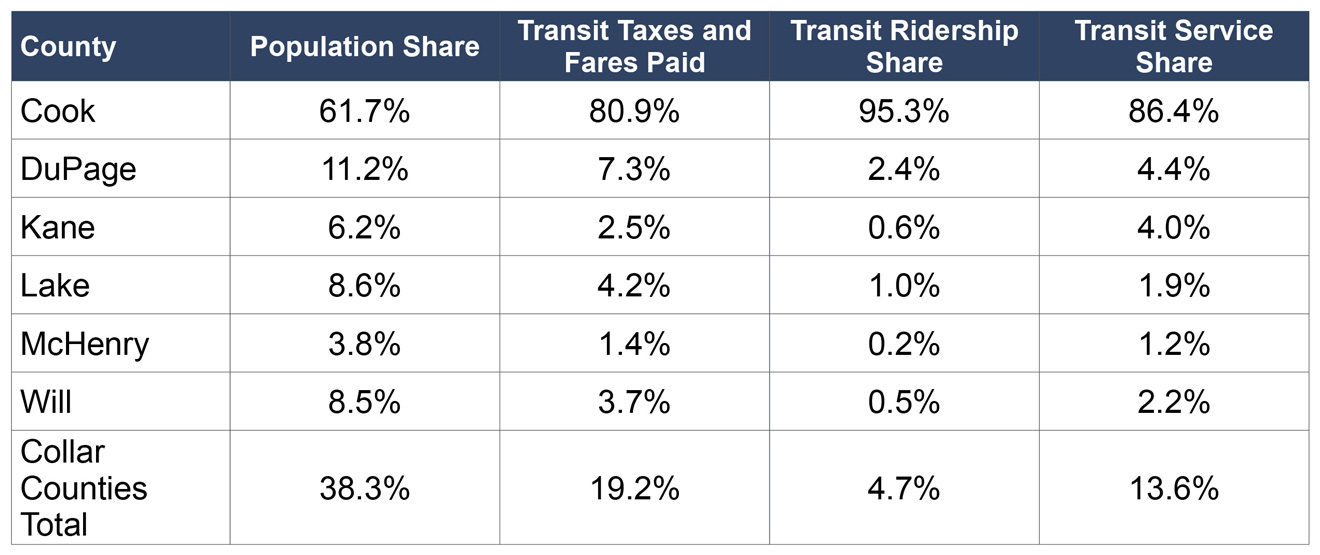
The share of transit service in the collar counties is lower than both the population share of those counties and the share of public funding for transit—RTA taxes and fares—paid by residents of those counties. Yet, the collar counties contribute fewer riders to the region’s transit system relative to the level of transit service provided in those counties. In contrast, Cook County’s share of transit service is less than the share of transit rides generated in that county:
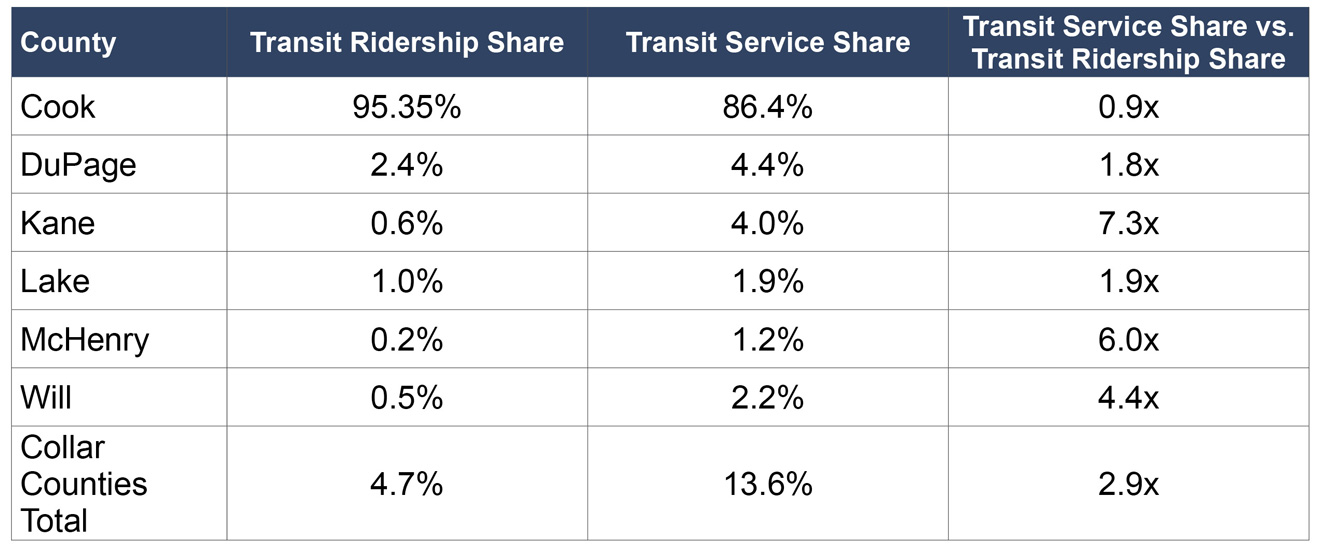
In other words, the collar counties are getting almost three times the amount of transit service than the share of transit riders they contribute to the transit system.
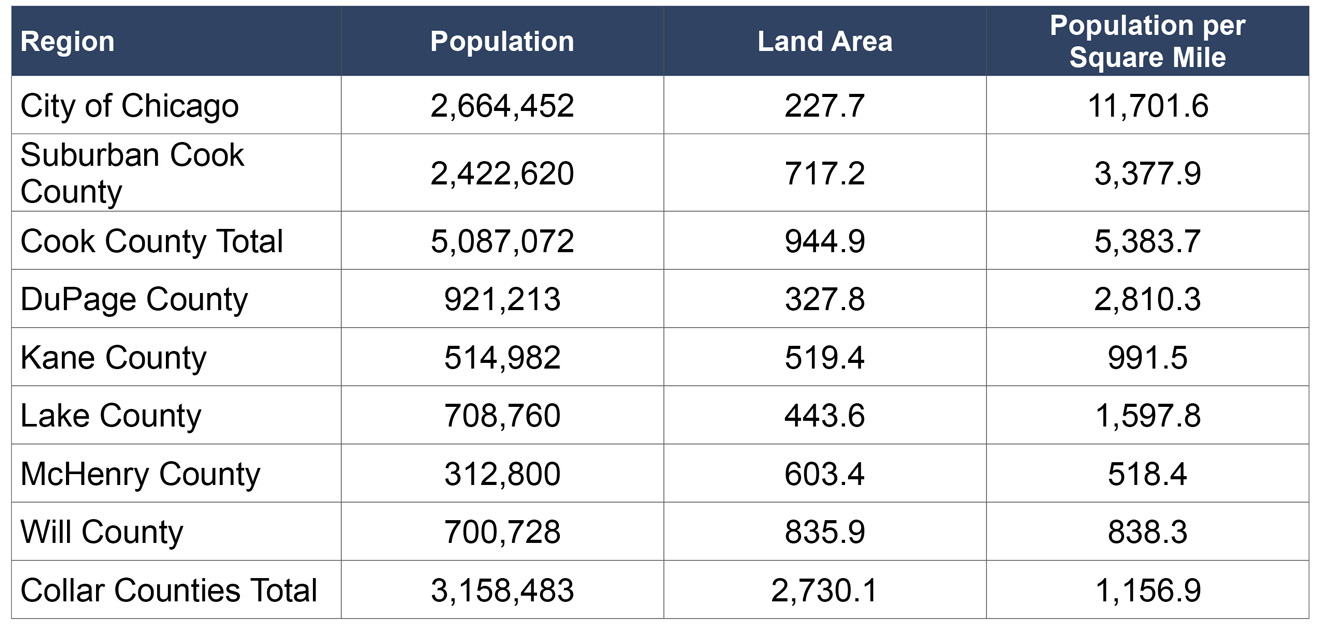
Population Density
The anemic transit ridership generated in the collar counties relative to the level of transit service provided in those counties is likely due to the low population densities in those counties relative to the population density in much of Cook County:
Population density by county:
Cost of Service
The low ridership in lower density regions means that transit costs are higher on a per passenger basis in those areas. These higher operating costs are evident in the RTA’s 2025 Regional Budget:

Source: RTA Adopted 2025 Operating Budget,Two-Year Financial Plan, and Five-Year Capital Program, November 2024
Likewise, the National Transit Database shows the cost of providing transit service on a per passenger basis varies significantly among the three transit service providers:
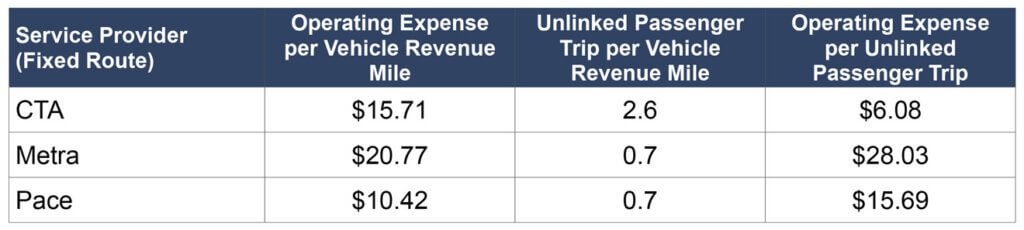
The CTA’s ability to provide over three times as many trips per vehicle revenue mile than Metra and Pace at a fraction of the cost per passenger trip is a function of its service area in the most densely populated part of the Chicago region. The big cost differential suggests that adding transit service in areas of relatively high density is most likely to yield the highest ridership returns per dollar invested.
Pace’s ongoing ReVision bus network redesign effort recognizes that transit ridership can be built more efficiently and cost-effectively in areas with higher population density. Its PacePlus50 scenario, which is designed to maximize ridership, targets improved service such as buses with 15- minute headways in areas of the region where the most people are, predominantly in Cook County. ReVision Appendix A at page A-7.
Other Considerations
There are considerations other than cost of service and ridership that come into play when optimizing the level of transit service. For example, higher priority might be given to providing transit service to low-income communities or those with a high percentage of transit dependent people. The value of a transit network as a whole is higher if people can reach lots of destinations in a timely fashion using that network, even though the cost of serving some destinations in the network is inevitably higher than the cost of serving other destinations.
MPC believes that this process of balancing competing priorities and needs when allocating transit service should be done on a regional basis, rather than within independent transit service provider silos. That is why MPC supports transit governance reforms that include regional transit service standards.
This region should also look to peer global metros for best practices for how to optimize the public transit system so that it serves the most people most efficiently and effectively. There are indications that the Chicago region is underinvesting in suburban transit relative to peers with similar demographics. Pace’s ReVision report (Figure 2), for example, found that bus service per resident in the Pace service area is only about 20% of the bus service per resident in the Toronto suburbs.
Likewise, the performance of the transit system in the Chicago region lags way behind that of metropolitan regions in Germany with roughly similar demographics:
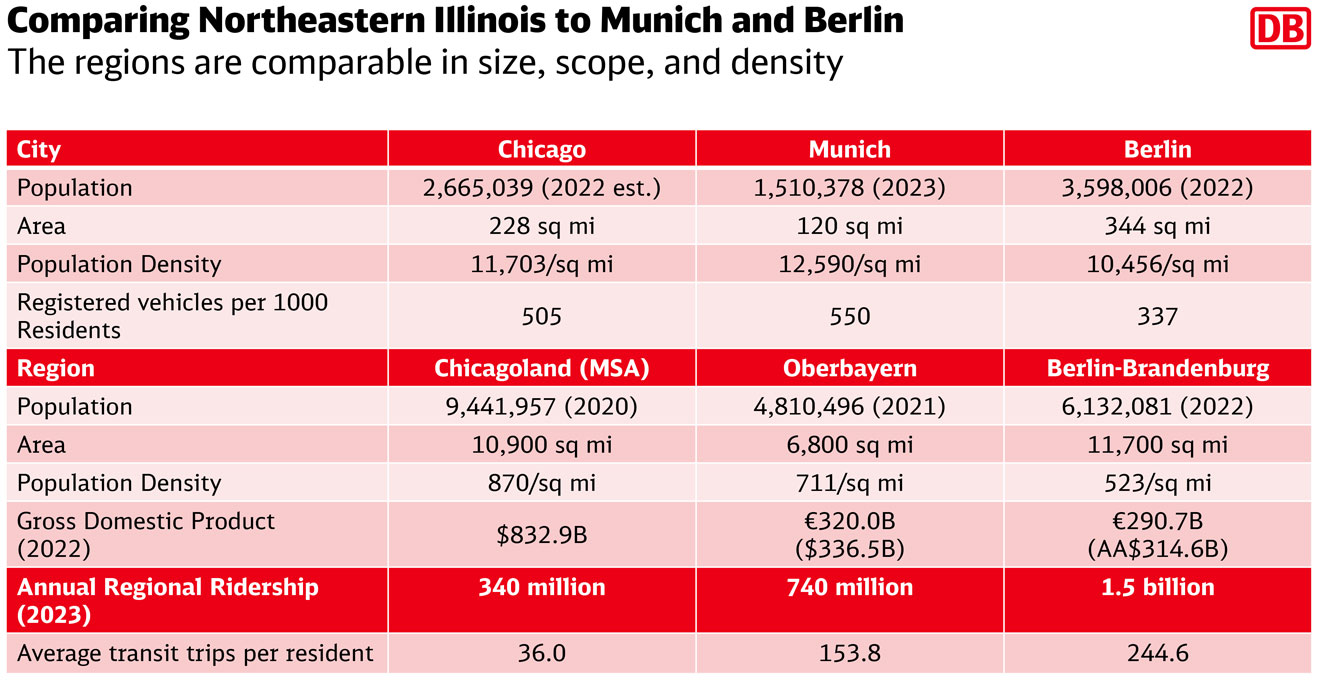
Given the linkages among the (i) quality of the public transit system—e.g., frequency of service, ease of access and payment, safety, coordination of connections—(ii) the amount of funding necessary to provide quality service, and (iii) the level of ridership on the system, these comparisons signal that operating and capital funding for the Chicago region’s transit system needs to increase significantly. MPC supports at least $1.5 billion/year in increased transit operating funding to improve the quality of transit service throughout the region.
Conclusion
This analysis, rough as it is, indicates that the share of public transit service in the five suburban collar counties is less than their share of population and their contribution of tax dollars and fares to the transit system. It also shows that the share of public transit service devoted to the collar counties much exceeds the transit riders these counties contribute to the system. Conversely, Cook County gets a smaller share of transit service than the share of riders it contributes to the system. The relatively high cost of service in the collar counties is also an important factor when considering where and how public transit service should be allocated. MPC believes that transit service allocation decisions should be made at the regional level, not by each transit service provider, and that maximizing the value, efficiency, and equity of the public transit system as a whole should be the goal.