
About the Project
The Chicago River System has evolved since the launch of the Our Great Rivers initiative. To determine if Chicago is reducing barriers to the good life and fostering shared prosperity for its residents and business all along the river system, this evaluation notes how the system and its surrounding communities have changed over time. Consistent with the project structure, the findings are organized into the themes of inviting, productive, and living.
About the Approach
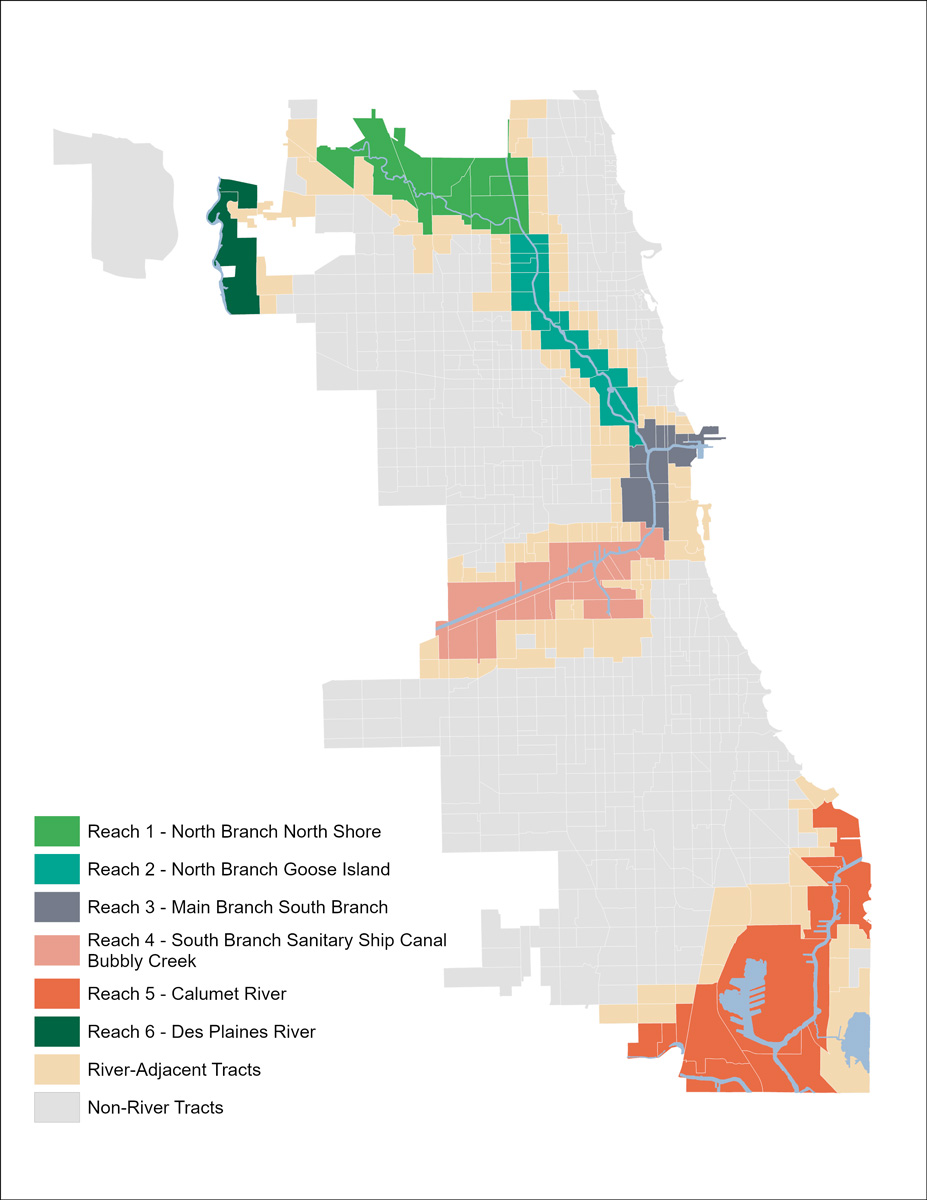
The Our Great Rivers project considers the Chicago River System as six distinct areas, or ‘reaches.’ The following analysis shares demographic, socioeconomic, community development, and ecological data and trends between approximately 2015 and 2025 to detail transformations along or near the river system.
In the Current
Want to get to know a catalytic project and leader bringing the vision of Our Great Rivers to life in Reach 4? To learn more about an initiative creating lasting benefits for local communities and the river system, explore a story of transformation: Park 571.
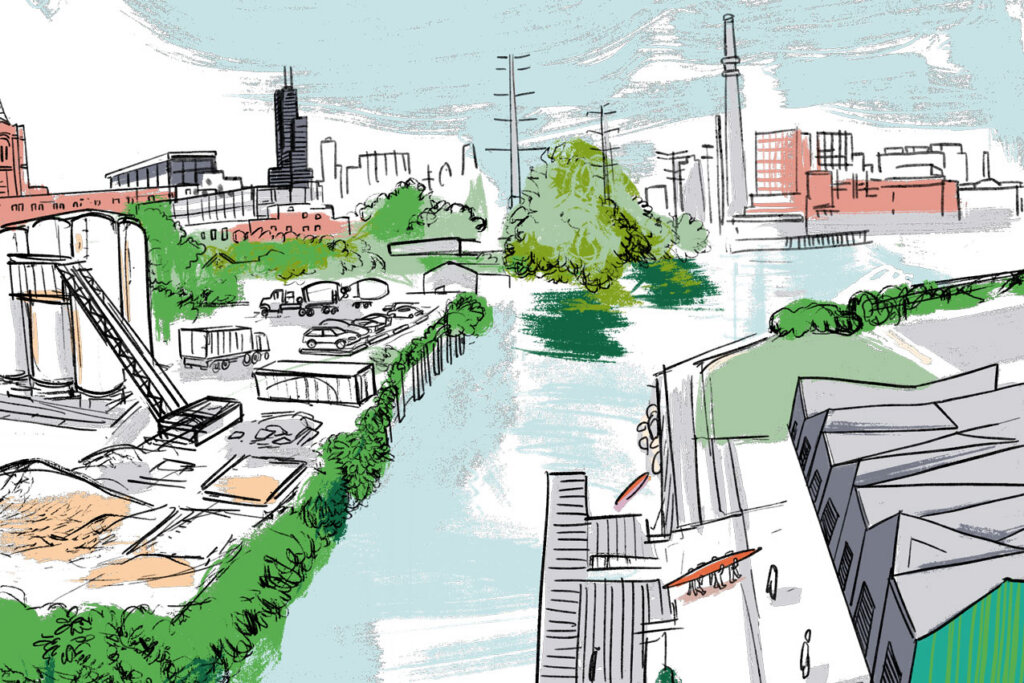
A Glimpse Into Reach 4: the South Branch/Bubbly Creek

Where is this reach located?
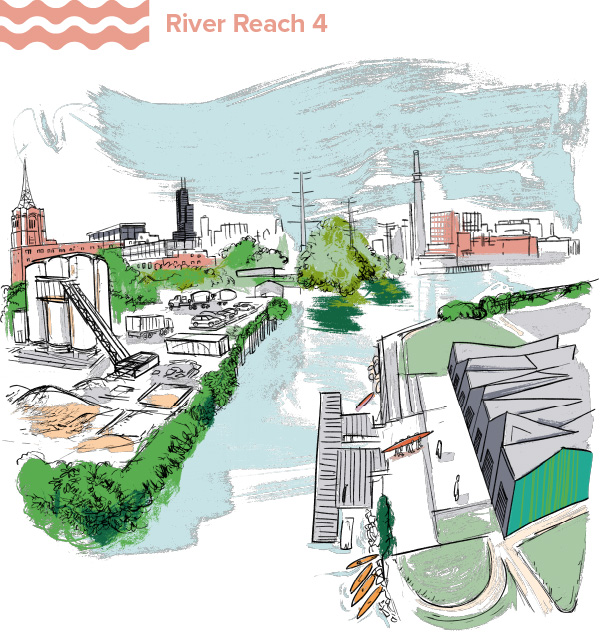
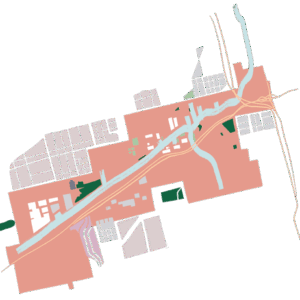
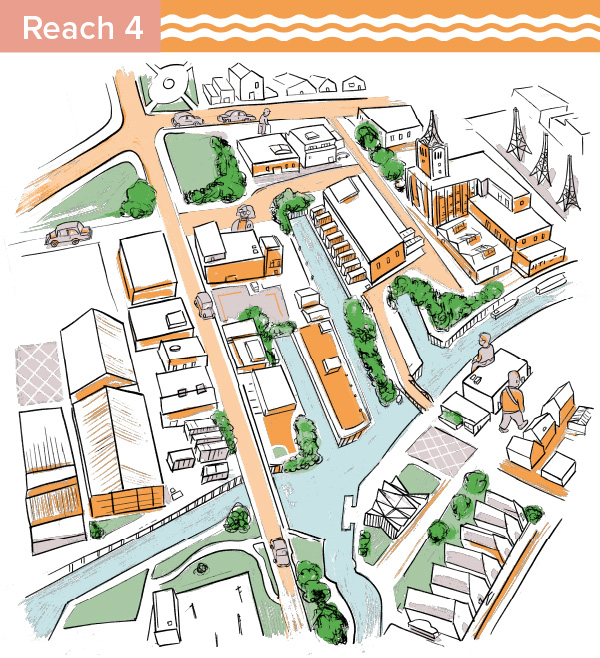
This reach includes the South Branch of the Chicago River, the Sanitary Ship Canal, and Bubbly Creek. Bounded by S. Cicero Avenue to the southwest and W 18th Street to the north, the overall length is 6.5 miles. The stretch includes the southern end of Ping Tom Park and other smaller parks including Park No. 571, Canal Origins, the Canalport Riverwalk Park, and La Villita Park. It touches the community areas of Chinatown, Armour Square, Pilsen, Bridgeport, Lower West Side, Little Village, McKinley Park, Brighton Park, Archer Heights, South Lawndale, and Garfield Ridge.
What are the main characteristics of this reach?
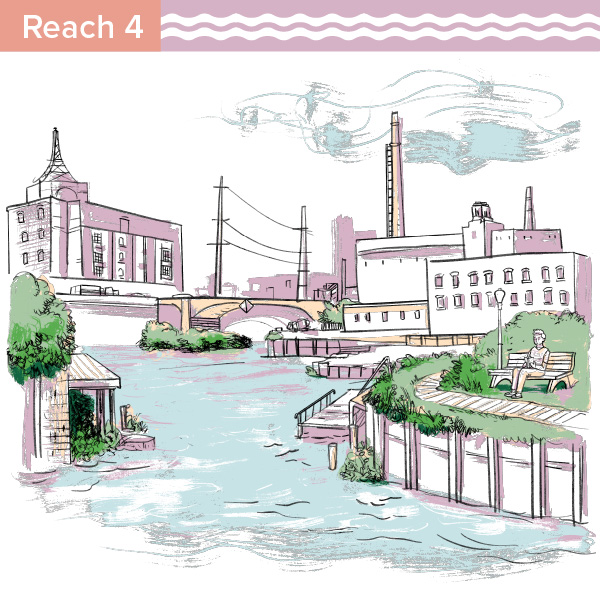
The South Branch/Bubbly Creek is characterized by its industrial legacy and ongoing, active industrial uses today alongside residential developments. Parks, including Ping Tom Park in Chinatown and Park No. 571 in Bridgeport, and trails have been added over time, but the industrial character still predominates.
What’s rising to the surface in this reach?
The key findings and trends of this reach show a nuanced story about this reach – and our river system as a whole. The South Branch/Bubbly Creek reach has maintained a relatively stable population, though population change has looked different across racial and ethnic groups. More Asian and white residents have moved in, and some Latinx residents have moved out. The area has gotten more expensive, with homes near the river seeing increasing values and rental costs at a higher rate than neighboring areas. There has also been investment in commercial, industrial, and multifamily development, as the vacancy rates of these property types have declined, and their sale and rental costs increased. Industrial land uses still dominate the riverfront in this reach, limiting access to public trails and open space. Bubbly Creek continues to face disproportionate combined sewer overflow impacts. At the same time, new riverwalks, community-led planning, habitat projects, and infrastructure investments demonstrate a path forward. The central challenge is to ensure that future development expands public access, restores ecological health, and delivers lasting benefits to the communities that have long lived and worked along the South Branch.
MPC developed data points to characterize changes along Chicago’s River System between approximately 2015-2025. This page gives a general overview of the ways the area surrounding this reach has, or has not, transformed. For more in-depth data, further analysis, and the sources used for this research, view the complete data sets at the link below.



(2014-2022)
Demographics

Socioeconomics
Inviting Rivers Data
How has the area become more, or less, inviting?

Land Use
Industrial land use predominates the South Branch, making up 40% of the share of land in river tracts 2020. For comparison, the next most common land use type is single family housing, which makes up just 14% of land use in this area.
The predominance of industrial use in the reach limits access to the river for recreation. Much of the Chicago Community Trust’s Our Great Rivers grant recipients’ work focused on making the South Branch more inviting. A particularly impactful example: Little Village Environmental Justice Organization (LVEJO) partnered with the Southeast Environmental Task Force and the Natural Resources Defense Council to develop a map showing the cumulative effects of environmental and social stressors, identifying the most burdened communities in Chicago. This helped set the groundwork for Chicago’s Cumulative Impact Assessment and Environmental Justice Action Plan, which includes specific policy changes to protect neighborhoods from the cumulative impact of environmental burdens.
Physical Improvements and Access Points
Productive Rivers Data
How has the reach become more, or less, productive?

Office, Industrial, and Multifamily Development
The average sale price per square foot for office, industrial, and multifamily property within 2 blocks of the river in this reach is relatively low compared to other reaches at $63.50 per square foot.
Vacancy
Jobs and Businesses
Living Rivers Data
How has this reach become more, or less, living?

Water Quality
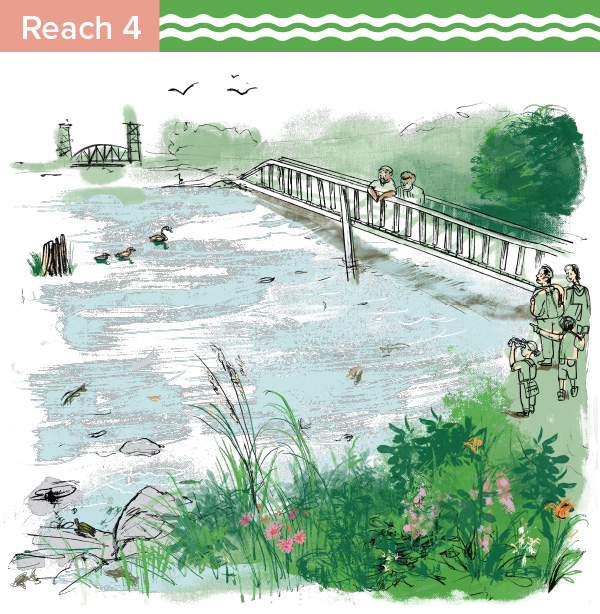
Chicago has a combined sewer system, meaning that sewage and stormwater from rainfall and melting snow enters the same pipe system. When this system is overwhelmed, the combined sewage and stormwater is emptied directly into our river system, polluting the river and increasing the risk of flooding. This emptying of sewage and stormwater into the river system is called a combined sewer overflow (CSO). Combined sewer overflows (CSOs) were more common in the South Branch/ Bubbly Creek reach than in other areas in Chicago’s river system. Between 2016 and 2021, this reach saw 1,251 CSO events. Bubbly Creek can be particularly affected by CSO events due to it’s nearly stagnant flow. The number of CSO events has declined over time with the Metropolitan Water Reclamation District’s (MWRD) efforts in the Tunnel and Reservoir Plan (TARP), that built large, deep tunnels and reservoirs that store stormwater and sewage until it can be treated, mitigating CSO events. The TARP reservoir that affects this reach is the McCook Reservoir. The first stage of the McCook Reservoir began operations in 2017. It is located between the Des Plaines River and Chicago Sanitary and Ship Canal in Bedford Park, and captures stormwater along the Des Plaines River, Salt Creek, Addison Creek, and the Chicago River from the North Branch and North Shore Channel, through the Main Steam, South Branch, Bubbly Creek, to the Chicago Sanitary and Ship Canal.
This first stage of the McCook reservoir was designed to contain up to 3.5 billion gallons. The second stage, set to be completed in 2032, has capacity for an additional 6.5 billion gallons. The tunnels and reservoirs built under TARP have played a major role in reducing CSOs in Chicago’s water system. The number of CSOs notably declined across all Chicago river reaches and the Des Plaines reach after the McCook Reservoir became operational in 2017. CSO events are complex: the severity of each event depends on the location, amount of impervious surfaces that exacerbate runoff, weather conditions, and other factors. Our region has not seen a complete elimination of CSO events, and some years continue to see more severe CSOs than others. It is important to continue to make ongoing efforts to reduce stormwater runoff and mitigate CSO events, as the effects of climate change, such as the heavy rainfall events we saw in the summer of 2026, continue to pose pollution and flooding challenges to the Chicago region.
Open Space
Explore the research on other reaches in the Chicago River System below.
Visit river reach pages:
View the complete data sets for each of the river reaches:



Learn more about Our Great Rivers and this Understanding Our Rivers evaluation project.
Methodology
Research Approach
This project examined how areas (census tracts) along the river changed over time, from approximately 2015 to 2025. Data related to demographic, socioeconomic, development, and ecological changes, were compiled to understand how areas along the river transformed over the decade. Trends/variables included:
- Population changes by racial and ethnic group
- Rent and home value changes
- Job, business, and vacancy rate changes
- Land uses
- Trails and access points
- Community projects and activations
- Fish diversity
In addition to breaking down the river geography at the citywide and “reach”-level scale, we examined data by census tracts based on their proximity to the river:
- River tracts: Census tracts that touch a river in the city of Chicago
- River adjacent tracts: Tracts that touch the “river tracts.” Data in these tracts act as a proxy to the nearby neighborhood in order to differentiate general neighborhood trends from findings that are unique to tracts that directly abut the river.
Research Questions
For each data area, we asked the following questions, which allow for a nuanced look at how river areas have developed, when compared to other parts of the city:
- How do trends/changes compare across specific river areas (aka “reaches”)?
- How do trends/changes along the river (aka “river tracts”) compare to changes in areas immediately adjacent to river census tracts (aka “river adjacent tracts”, which are the comparison groups)?
- How do trends/changes along the river compare to changes across the city as a whole (all city census tracts)?
Sources
All sources for this research are listed on the Data Set Factsheets available on each reach page.
Authors
This evaluation project was produced by the MPC staff listed below. It was also developed and supported by Christina Harris, Alec Singer, and Kate Mackie.


